Why Prodfiler
Prodfiler provides fleet-wide full-system continuous profiling. Understand what lines of code are consuming CPU resources, at all times, and across your entire infrastructure. Identify performance regressions, wasteful computation and other issues.
Create an account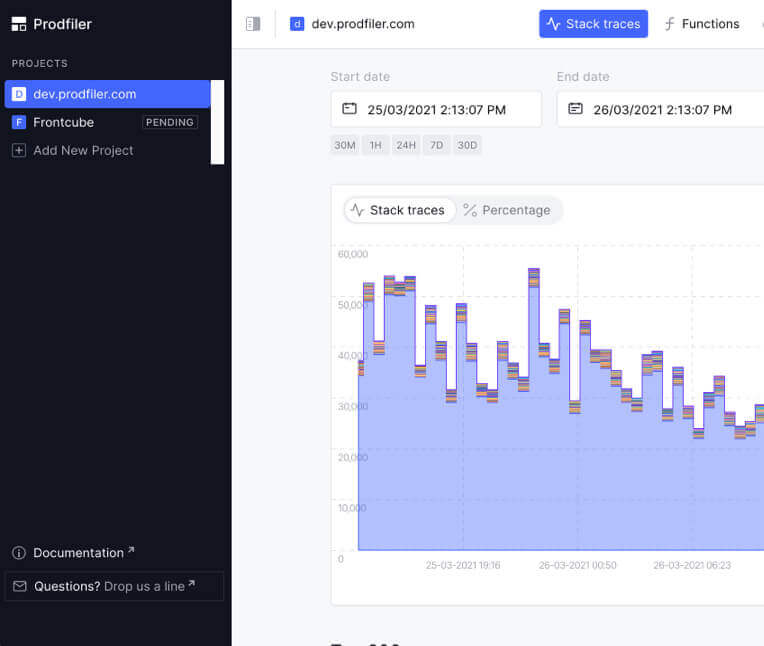
How it works
Get started with Prodfiler by following these easy steps.
Sign up with Prodfiler
Register for an account and create your first project.
Deploy the agent
Deploy the Prodfiler agent to individual machines, or to your entire cluster.
Optimize!
Using the Prodfiler UI, explore the most expensive lines of code and functions across your entire fleet. Identify performance bottlenecks and cost-saving opportunities.


Frictionless Deployment
Prodfiler does not require any application source code change, instrumentation, on-host debug symbols or other intrusive operation. Just deploy the agent and receive profiling data a few minutes later.
All interpreted languages, as well as those running on the HotSpot VM, are automatically symbolised without any user action. Prodfiler will also automatically symbolise any native code stack frames from open source packages in popular distributions. We provide an API to allow you to upload symbols for all other software - although Prodfiler does not need these symbols to gather traces, only to symbolise them in the UI after the fact.
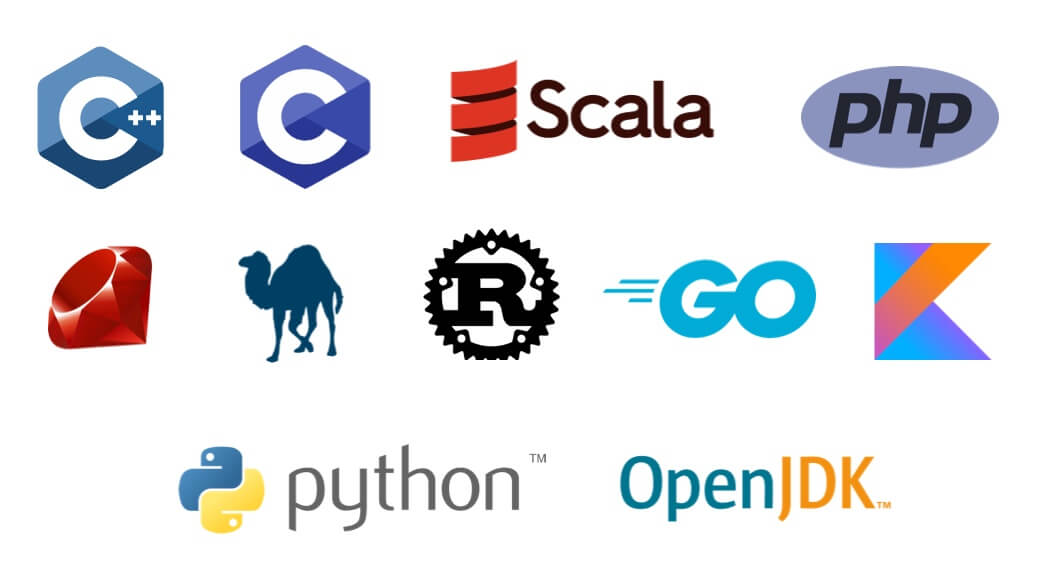
All the Languages
Prodfiler supports almost all popular language runtimes. We support native C/C++, Rust and Go code, even without debug symbols, as well PHP, Python, Java, Scala, Ruby and Perl. Support for NodeJS and .NET are coming soon. Prodfiler even supports mixed-language stack traces - Python or Java code calling native code and then calling into the kernel? No problem!
When building Prodfiler we decided to build all of the per-language profilers from the ground up on a common foundation, rather than reusing existing open source profilers and trying to integrate the results. This enables high performance profilers for each language, profiling of both userland and kernel level code, and the gathering of individual traces that may span any of our supported languages. The result is true whole-system profiling.
Containerised Environments
Prodfiler has first-class support for all the major containerisation and orchestration frameworks, whether you are running them on your own platform or on top of a managed platform, such as GKE, AKS or EKS. Of course, we also support non-containerised environments!
Deploying Prodfiler is straightforward, regardless of how you host your applications. The agent can be manually run as a native binary or as a privileged Docker container, or you can have it automatically deployed using your cluster's orchestration framework, e.g. via a Helm chart.
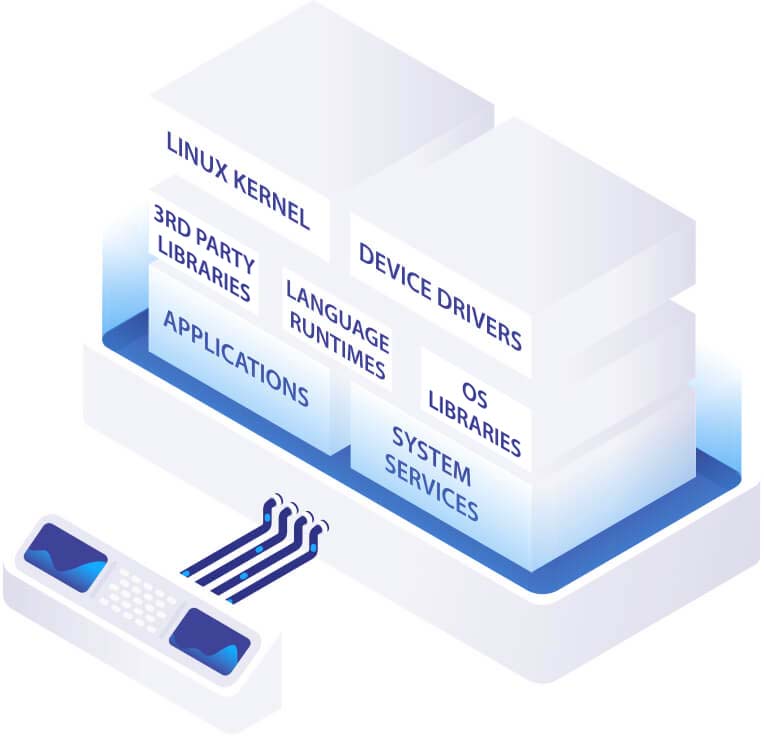
Whole-System Visibility
Prodfiler builds stack traces that go from the kernel, through userspace native code, all the way into code running in higher level runtimes, enabling unprecedented insight into your system’s behaviour at all levels.
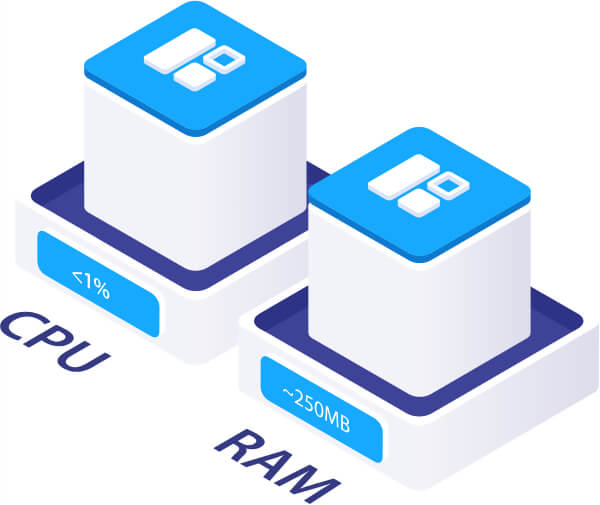
Extremely Low Overhead
Prodfiler aims to stay within a budget of 1% of CPU usage and less than 250MB of RAM, meaning that for most workloads it can run 24/7 with no noticeable impact on the profiled systems. For workloads where even this CPU budget is too high, Prodfiler can run at randomly selected time intervals to gain insights with an even lower impact on performance.
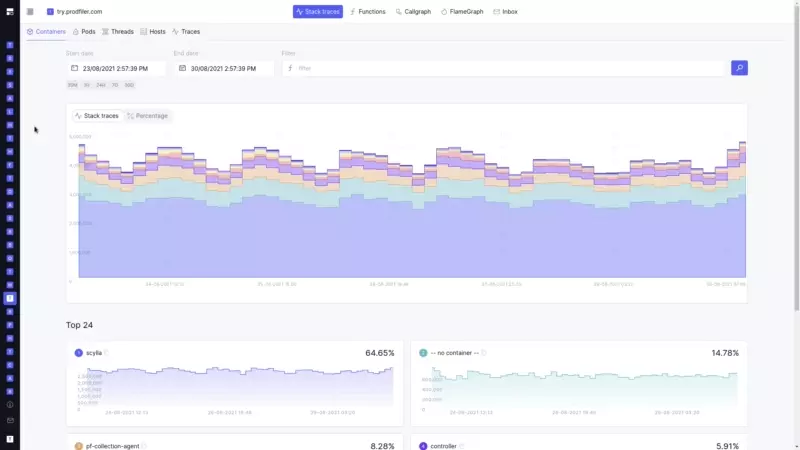
Powerful User Interface
The Prodfiler UI identifies your most expensive lines of code and functions, providing estimates of their dollar cost and CO2 usage. Featuring responsive and easy to use flame-graphs and call-graphs, you can explore the performance of your entire fleet in one location.
Supported Languages & Platforms
Prodfiler currently supports C/C++, Rust, Go, PHP, Python, Java, Scala, Ruby and Perl, with support for .NET and Node.js coming soon. Prodfiler works in both containerised and non-containerised environments, so whether you’re deploying individual Docker containers, or running large Kubernetes clusters on a managed platform we’ve got you covered!
Resources
Learn more about continuous in-production profiling and it's impact on performance and cost!
- Read our performance blog 06 Aug 2021
- Subscribe to our newsletter 06 Aug 2021