The OOMsday device

Victor Michel
Sep 7, 2021 @vic_mic_Note: this blog entry builds upon Mark Mossberg ’s excellent article: What they don’t tell you about demand paging in school. Reading it first is highly recommended!
We will take a completely unreasonable program that attempts to run out of memory in a very convoluted way, and do some uncalled-for performance analysis on it.
Why? This definitely falls in the category of experiments that go a little too far. But it’s not about the destination; we’re using profiling as a learning method to discover more about the Linux kernel. Wherever that takes us!
The article contains a few small snippets of the Linux kernel’s source code. In case you want to look around by yourself a little more, the code and line numbers are from version 5.13.6.
We will talk about Linux demand paging, transparent huge pages, x86 virtual memory, and of course, profiling. We will also learn some dubious skills, like forcing the kernel to iterate billions of times to terminate a process!

Exhausting memory without using memory
Mark’s article contains an interesting example of how a process can run out of memory despite having almost no physical memory explicitly allocated.
It does so by relying on 2 things:
- A mechanism known as demand paging, which allows the kernel to defer populating virtual->physical memory mappings until they are actually needed for a read or a write.
- A kernel optimization that consists in reusing the same physical “shared zero page” to serve all memory reads under certain circumstances.
As described in Mark’s article, if a program reads from enough memory pages (all served by the same shared zero page), it will eventually run out of memory because of the overhead of bookkeeping virtual->physical mappings in the process page table.
Here’s an equivalent code snippet to reproduce that behavior. Compile with -O0 -static1.
#include <sys/mman.h>
#include <stdlib.h>
#include <stdio.h>

const size_t KB = 1024;
const size_t MB = KB * 1024;
const size_t GB = MB * 1024;
const size_t TB = GB * 1024;
const size_t READ_INTERVAL = 4096; // Default page size

int main() {
    size_t size = 127 * TB;
    char* base = NULL;

    // mmap'ing 127 TiB. 128 TiB is the maximum we can ask for on x86 Linux,
    // and our program already needs some memory to run, so we round things
    // down to 127 TB.
    // Compiling with -static is required to avoid overlapping shared library
    // mappings, which would cause mmap to fail.
    base = (char*)mmap(NULL, size, PROT_READ, MAP_PRIVATE | MAP_ANONYMOUS, -1, 0);
    if (base == MAP_FAILED) {
        perror(NULL);
        return -1;
    }

    // Read the first byte of each page.
    // Every iteration is actually reading the same exact physical location in
    // memory. All the reads are served by a single shared "zero page": no
    // physical memory is allocated for the reads.
    for (size_t i = 0; i < size; i += READ_INTERVAL) {
        char x = base[i];
    }
    return 0;
}
As Mark puts it:
After a few minutes, memory was exhausted, and the OOM killer killed the process.
My 16 GiB RAM laptop eventually gets there too after several minutes2.
Investigating OOM performance
The program fully utilized one CPU core for several minutes, pegging it at ~100% until the OOM killer put an end to it. Questions sane people may not ask: why does it take so much time to go OOM? What’s with the high CPU usage?
But let’s abandon sanity and try to make the program OOM faster. We can use our profiler on this abomination!
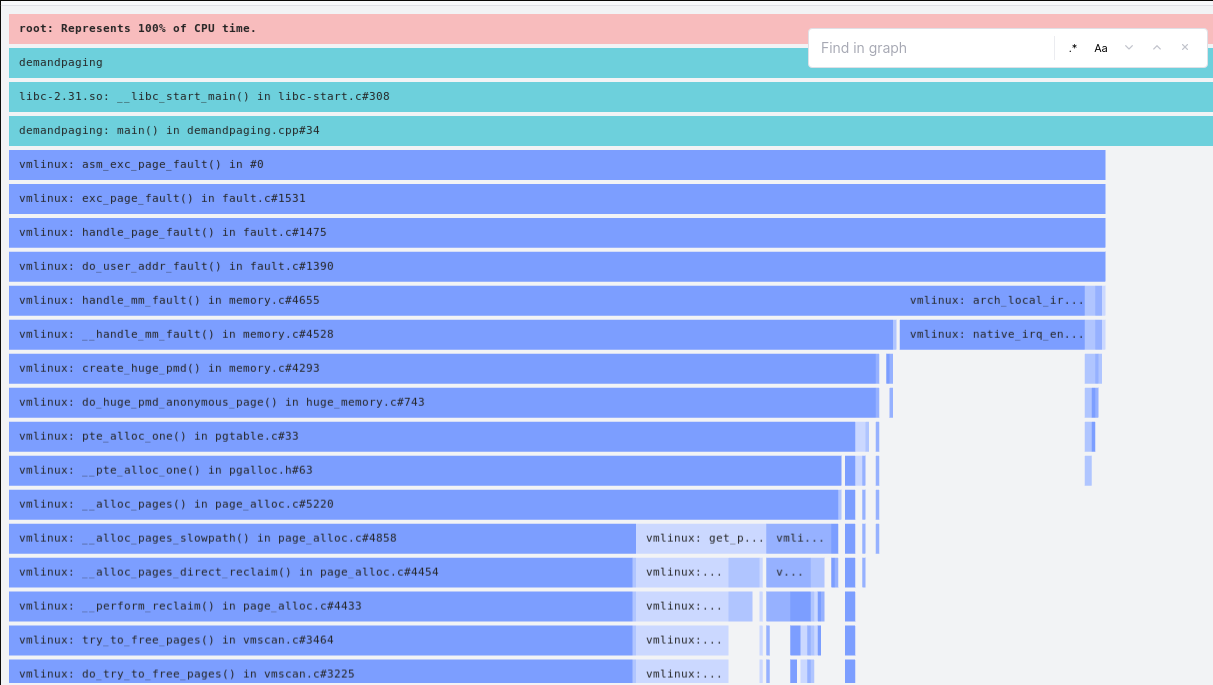
Here we can see that most time is attributed to native_irq_enable - a function that simply sets a CPU flag that re-enables interrupt handling on a core. This can be a bit misleading - this function is extremely cheap3 and not called in a tight loop, so this deserves a little explanation.
But to make sure this article stays somewhat easy to follow, we’ll discuss this in an appendix.
Interpretation of the flame graph
Back to our flame graph. If you trust what’s discussed in the appendix, the flame graph doesn’t imply that most CPU cycles are spent in native_irq_enable. Instead, it implies that most CPU cycles are spent between 2 events:
- After page faults are triggered by the memory management unit (MMU), when a virtual->physical mapping can’t be found in the page tables.
- Before the kernel re-enables IRQ handling for the corresponding CPU core, in
do_user_addr_fault.
Here’s the relevant code for do_user_addr_fault. Note: the cr2 register mentioned in the comments below is the CPU register that contains the address that triggered the page fault.
1212 static inline
1213 void do_user_addr_fault(struct pt_regs *regs,
1214             unsigned long error_code,
1215             unsigned long address)
1216 {
[...]
1279     /*
1280      * It's safe to allow irq's after cr2 has been saved and the
1281      * vmalloc fault has been handled.
[...]
1285      */
1286     if (user_mode(regs)) {
1287         local_irq_enable(); // <<< IRQs re-enabled
1288         flags |= FAULT_FLAG_USER;
1289     } else {
1290         if (regs->flags & X86_EFLAGS_IF)
1291             local_irq_enable();
1292     }
Inspecting the kernel code, it is worth noting that IRQs are re-enabled before the kernel actually does anything to deal with the page fault. Reserving physical memory if needed? Creating a virtual->physical mapping in the page tables? None of that happened yet at the time IRQs are re-enabled.
Time is mostly spent on the “plumbing” related to page faults, rather than on actually dealing with the page fault. Each page fault means the MMU had to walk the page table after a TLB miss, then triggered an interrupt that led to a context switch to the kernel, which is costly.
As shown on the screenshot/video, we can also see that the time spent allocating memory in the page tables (in __pte_alloc) is relatively insignificant compared to the rest. Clearly, this is not efficient. We must do better and OOM faster!
A side trip: Transparent Huge Pages
A little bit of background first, for those unfamiliar.
To reduce overhead on the MMU (and especially the TLB), programs can make use of pages larger than the default (4 KiB). These are known as “Huge Pages”.
This requires hardware support, as both the TLB and the MMU’s page miss handler need to know about page sizes. x86 processors, for example, have supported larger pages for decades. On the software side, the Linux kernel has been supporting huge pages for a while.
However, using huge pages effectively can be a little tedious. As a result, some brave contributors introduced a feature called Transparent Huge Pages. This Linux kernel feature promises to bring the benefits of huge pages to all programs, without having to explicitly modify their source code. The benefits are such that Linux distributions often enable THP by default, although this is not always popular.
In practice, enabling THP means pages can be 2 MiB instead of 4 KiB when the kernel’s THP heuristics decide it would be beneficial. Small pages can be transparently merged into huge pages, and huge pages can be transparently collapsed into smaller pages.
OOM-ing, THP-style
Back to our problem. Without expecting much, we can enable THP just to entertain our curiosity and see if it makes things slower or faster.
# echo always > /sys/kernel/mm/transparent_hugepage/enabled
We can also increase READ_INTERVAL in our program to 2 * MB4. With THP, the zero page is now 2 MiB large5, so there is no need to read memory in 4 KiB chunks: 511 out of 512 reads wouldn’t trigger a page fault.
Running the program, things get seriously faster. The program gets OOM-killed in just a few seconds:
$ time ./demandpaging
Killed

real	0m4.865s
user	0m0.418s
sys	0m3.647s
What’s happening? Let’s look at what the process is doing before it OOMs:
Notice how we’re now utilizing cycles much more effectively. The trace that ended with native_irq_enable (visible on the right), is now comparatively less frequent.
And __pte_alloc_one on the other hand, is now dominating the flame graph.
Wait, what?
Being a stranger to the gnarly internals of transparent huge pages, I was really confused as to why the system would OOM much faster with THP enabled.
Handling page faults is ultimately what causes the program to take time to execute, and I thought it would take the same amount of page faults to cause an OOM situation, and hence the same amount of time. Sure, the shared zero page from THP is larger than its non-THP counterpart. But it’s not that page that fills up the memory, it’s all the entries we add in page table hierarchy. So why would the page size matter?
Figuring this out required a bit of spelunking, following the locations indicated by the flame graph. To illustrate, here’s the code that’s hit on every page fault:
First, in mm/memory.c:
4471 static vm_fault_t __handle_mm_fault(struct vm_area_struct *vma,
4472         unsigned long address, unsigned int flags)
[...]
4527     if (pmd_none(*vmf.pmd) && __transparent_hugepage_enabled(vma)) {
4528         ret = create_huge_pmd(&vmf);       // <<< we hit this
4529         if (!(ret & VM_FAULT_FALLBACK))
4530             return ret;
Which calls this:
4290 static inline vm_fault_t create_huge_pmd(struct vm_fault *vmf)
4291 {
4292     if (vma_is_anonymous(vmf->vma))
4293         return do_huge_pmd_anonymous_page(vmf); // <<< then this
4294     if (vmf->vma->vm_ops->huge_fault)
4295         return vmf->vma->vm_ops->huge_fault(vmf, PE_SIZE_PMD);
4296     return VM_FAULT_FALLBACK;
4297 }
The flow then goes into mm/huge_memory.c:
 724 vm_fault_t do_huge_pmd_anonymous_page(struct vm_fault *vmf)
 725 {
 [...]
 737     if (!(vmf->flags & FAULT_FLAG_WRITE) &&
 738             !mm_forbids_zeropage(vma->vm_mm) &&
 739             transparent_hugepage_use_zero_page()) {
 740         pgtable_t pgtable;
 741         struct page *zero_page;
 742         vm_fault_t ret;
 743         pgtable = pte_alloc_one(vma->vm_mm); // <<< and then this
 744         if (unlikely(!pgtable))
 745             return VM_FAULT_OOM;
 746         zero_page = mm_get_huge_zero_page(vma->vm_mm); // <<<< we get the zero page
[...]
 752         vmf->ptl = pmd_lock(vma->vm_mm, vmf->pmd);
 753         ret = 0;
 754         if (pmd_none(*vmf->pmd)) {
[...]
 764             } else {
 765                 set_huge_zero_page(pgtable, vma->vm_mm, vma, // <<< use pgtable to hold the zero page mapping
 766                            haddr, vmf->pmd, zero_page);
 767                 update_mmu_cache_pmd(vma, vmf->address, vmf->pmd);
 768                 spin_unlock(vmf->ptl);
 769             }
Finally, pte_alloc_one makes its way to __pte_alloc_one in include/asm-generic/pgalloc.h:
 59 static inline pgtable_t __pte_alloc_one(struct mm_struct *mm, gfp_t gfp)
 60 {
 61     struct page *pte;
 62
 63     pte = alloc_page(gfp); // <<< allocates a full page!
What we can learn from the above is that every such page fault with THP enabled will always allocate 4 KiB in the page table hierarchy so that page table entries (aka PTEs) can be stored.
Let’s illustrate further with a diagram of how the mappings are stored in memory (diagram from https://lwn.net/Articles/117749/)

(the name under each box is not the name of the box, it is the name of the elements in that box.)
- The black box is known as “Page Map Level 4”, aka PML4.
- Green, cyan and purple boxes are respectively known as “Page Directory Pointer Table”, “Page Directory” and “Page Table” (yes, that term is overloaded!).
Every block on that diagram is 4 KiB large. Each block contains 512 slots of 8 bytes each (which may or may not be set).
What’s happening here is that every page fault with THP enabled allocates one page table (purple block), which can hold 512 PTEs (page table entries).
This seemed unexpected to me at first: the whole point of huge pages is to reduce the number of memory mappings, so it seems strange that the mechanism would require allocating space for 512 PTEs, when 511 out of the 512 will be left unused!
As it turns out, transparent huge pages are more complex than I thought. While investigating this behavior, I stumbled upon this LWN article6, which mentions:
[…] it allows a huge page to be simultaneously mapped in the PMD (huge page) and PTE (regular page) modes
The behavior we are seeing here seems to be an artifact of that. Even though huge pages could be mapped at the PMD level (saving the need for PTEs), sometimes they must also be mapped at the PTE level. Again, what’s interesting here is that the purple block can hold 512 entries, but as far as I can tell we’re only using one, while the other PTE slots seem unused.
All this seems suboptimal, but other constraints are likely at play. And our workload that just reads zeroes is probably not worth optimizing from a kernel perspective.
It’s also worth remembering that THP doesn’t mean that all pages are automatically huge pages, so it might be premature for the kernel to map that page only at the PMD level. While I can’t claim to understand everything that’s going on here, this is not as unexpected as I thought.
Are we fast enough yet?
I could now be happy with my new OOMsday device (dad joke: check!), but staring at the page table hierarchy diagram and related kernel code for long enough made me realize something7.
In include/linux/pgtable.h, we can see the details of how the page table data structure can be traversed:
43 static inline unsigned long pte_index(unsigned long address)
44 {
45     return (address >> PAGE_SHIFT) & (PTRS_PER_PTE - 1);
[...]
49 static inline unsigned long pmd_index(unsigned long address)
50 {
51     return (address >> PMD_SHIFT) & (PTRS_PER_PMD - 1);
[...]
57 static inline unsigned long pud_index(unsigned long address)
58 {
59     return (address >> PUD_SHIFT) & (PTRS_PER_PUD - 1);
[...]
65 /* Must be a compile-time constant, so implement it as a macro */
66 #define pgd_index(a)  (((a) >> PGDIR_SHIFT) & (PTRS_PER_PGD - 1))
This defines a radix tree, where looking up a child consists in a direct array lookup.
It’s a very basic data structure, and for good reasons: lookups in the tree are performed entirely in hardware by the MMU (the page miss handler, or page table walker). Assuming normal circumstances / non-insane users, the radix tree is a pretty compact data structure, and provides a very simple O(1) lookup mechanism:
Let’s say the CPU needs to find the physical address of addr in the tree. The MMU will do the following:
- Decompose
addr:(Ipgd, Ipud, Ipmd, Ipte, pageOffset) := (bits 40-48, bits 31-39, bits 22-30, bits 13-21, bits 1-12) - Lookup
pagePhysAddr := PML4[Ipgd][Ipud][Ipmd][Ipte], doing 4 consecutive array lookups. - If any of the lookups fails (missing data), trigger a page fault and let the kernel populate the missing data.
- The physical address is
pagePhysAddr + pageOffset.
As we can see, lookups are simple, but this type of prefix-indexed data structure means that the more prefixes differ, the more memory is needed for the data structure.
The original code of our OOM-ing program (from Mark’s original post, and the equivalent version at the top of this page) was triggering page faults to populate all the PTEs. But in hindsight, this isn’t particularly efficient: populating PTEs doesn’t actually cause memory allocations, and we don’t need to populate all PTEs in that data structure.
What we accidentally did with the transparent huge pages experiment was avoiding 512 page faults to allocate purple boxes, doing a single page fault instead.
But as it turns out, we didn’t need transparent huge pages. We can disable them8, and simply keep READ_INTERVAL at 2 * MB. Each page fault will still have to allocate space for 512 PTEs. Even though we’ll be populating only one, the kernel will be forced to allocate a full page per PTE every time, as the data structure is incompressible.
With THP disabled and reads every 2 MiB, let’s measure execution time again:
$ time ./demandpaging
Killed

real	0m6.749s
user	0m0.386s
sys	0m6.246s
The program OOMs much faster than the original version without THP. But interestingly, it is still running 2 seconds slower than with THP enabled.
We will come back to that later.
One step further
Can we do better to increase the memory overhead of page faults? Yes! Why focus on allocating purple blocks? We could change our logic so page faults force the kernel to also allocate as many cyan and green blocks as possible!
We can do this by changing our memory scan algorithm to prioritize creating new PGDs, PUDs and PMDs (in that order) - essentially filling it breadth-first instead of depth-first. For this we just need to start from the (Ipgd, Ipud, Ipmd, Ipte) decomposition, and cycle through all Ipgd and Ipud values prior to cycling through new Ipmd values.
For example:
#include <sys/mman.h>
#include <stdlib.h>
#include <stdio.h>

const size_t KB = 1024;
const size_t MB = KB * 1024;
const size_t GB = MB * 1024;
const size_t TB = GB * 1024;

int main() {
    size_t size = 127 * TB;
    char* base = NULL;

    base = (char*)mmap(NULL, size, PROT_READ, MAP_PRIVATE | MAP_ANONYMOUS, -1, 0);
    if (base == MAP_FAILED) {
        perror(NULL);
        return -1;
    }

    for (size_t pmd_index=0; pmd_index < 512; ++pmd_index) {
        for (size_t pud_index=0; pud_index < 512; ++pud_index) {
            // The pgd loop will stop before 256 because of address space limitations.
            // We can't allocate a region large enough that would span 512 PGDs.
            for (size_t pgd_index=0; pgd_index < 512; ++pgd_index) {
                size_t idx = ((((((pgd_index << 9)
                    + pud_index) << 9)
                        + pmd_index) << 9)
                            + /* pte_index = */ 0) << 12;
                if (idx >= size) {
                    break;
                }
                char c = base[idx];
            }
        }
    }
    return 0;
}
With such an approach:
- The first ~256 page faults will trigger allocations at every level of the page table hierarchy (except the top one, which is already allocated). That represents 3*4 = 12 KiB of overhead per page fault.
- After ~256 page faults, all the PGDs (green boxes) are allocated, the overhead goes down to 8 KiB per page fault.
- After ~131,072 = 256*512 page faults, all the PUDs (cyan boxes) are allocated, and the overhead goes down to 4 KiB per page fault.
- After ~67,108,864 = 256*512*512 page faults, all the PMDs (purple boxes) are allocated.
- Subsequent page faults will not require allocations. They will only trigger a PTE to be populated, but we’ll be OOM long before that!
In the original post, running on a 1 GiB RAM machine, the amount of memory to map before triggering the OOM killer was 512 GiB. How much do we need with this new scheme?
For 1 GiB, it turns out we now only need about 130,944 page faults: 256 + (1*1024*1024 - (12*256)) / 8. That represents about 512 MiB of memory.
Yes: 512 MiB worth of zeroes (all backed by the shared zero page) requires the kernel to allocate 1 gigabyte to store the mappings. That’s a nice 1024x9 improvement!
Adding a getchar() to pause our program after 130,944 page faults, we can open /proc/<pid>/status to confirm the above calculations:
$ grep -E 'VmRSS|VmPTE' /proc/17530/status
VmRSS:	     628 kB
VmPTE:	 1045012 kB
We see VmRSS being well under a megabyte (as expected, due to all mappings sharing the same zero page), while VmPTE10 is right around the gigabyte mark.
Overall, with this new method, it seems we’re putting more pressure on the page tables by increasing the number of allocations per page fault (at least initially). But nothing can ever be that simple. There’s actually a more profound performance issue with this algorithm - can you spot it? But I will park that in a long footnote11 to avoid overcomplicating & derailing this blog post into more chaos :)
Interlude: to infinity NaN and beyond
Ok, so we’ve got a nice 200% overhead: 512 MiB mapped to physical memory requires an additional 1 GiB of memory. But we can now make the overhead infinite with this one simple trick!
To let the kernel know that a page can be freed, we can issue a madvise 12 system call for that page13, with the MADV_FREE flag. This is legit - this way of freeing memory from mmap’ed regions is actually used by some14 memory allocators.
The man page says:
MADV_FREE (since Linux 4.5)
The application no longer requires the pages in the range specified by addr and len.
The kernel can thus free these pages, but the freeing could be delayed until memory pressure occurs.
So, if we now amend our program to free each page immediately after we read from it, we could logically claim that no physical memory is allocated after each iteration.
You can try this at home, but I’ll just reveal the spoiler: it does not make any difference, the program OOMs. While the kernel may free the page’s memory (it will not in our case, because it’s the shared zero page), it will not free the memory allocated in the page tables, no matter how high memory pressure is. Page table memory is never marked as eligible for reclaiming.
And that’s it, we’ve achieved “infinite” page table overhead! with madvise and a little bit of mental gymnastics!
But know that if you are ready to partake in a crime against common sense, it is actually possible to free page tables without having to use munmap. Prospective common sense criminals may read Appendix B: A crime against common sense.
More seriously, it is interesting to note that page table memory is in general not reclaimable until the memory region is munmap’ed, even for read-only file-backed mappings. I fail to see a scenario where this would actually matter, but it seems interesting nonetheless.
Profiling the result
Let’s forget about this madvise madness, and let’s profile our updated program with the new traversal algorithm - maybe we’ll notice more interesting things!
Here’s a flame graph that covers the execution prior to the OOM event.
Nothing out of the ordinary here:
- We can confirm that the cost of handling the page fault interrupts / context switches stays relatively low despite transparent huge pages now being disabled.
- On the video, we can notice some
pmd_alloc_oneframes which we didn’t see before - this makes sense, since we’ve been much more aggressive allocating space for PMDs.
Process exit: a costly operation
Let’s now look at a flame graph for the process full duration, including the OOM event and the process exit:
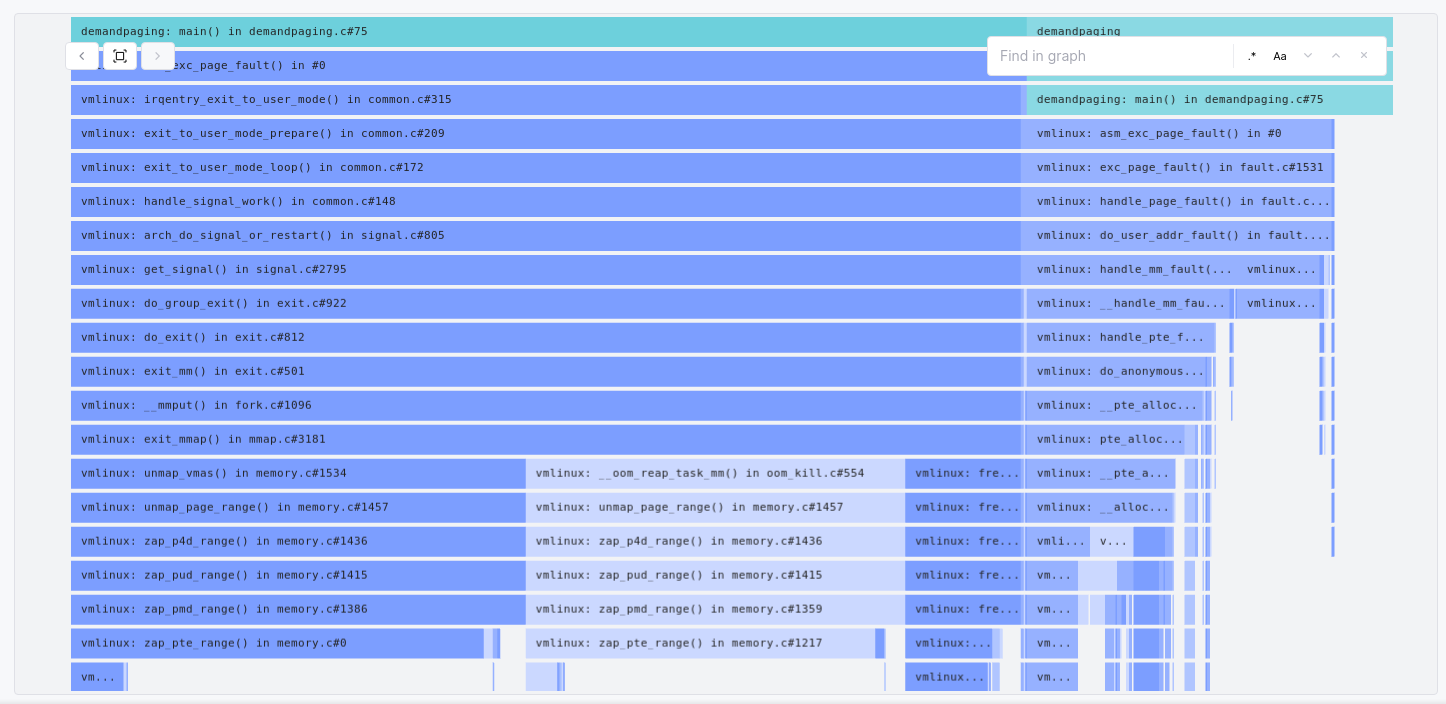
The cycles spent on page faults & allocating memory in the page table hierarchy are still on the right.
But there’s a new contender: the process spent more cycles exiting (do_exit) than executing! What’s going on here?
All of this is again mostly due to the completely insane layout that we’ve created in the process page tables:
1. Traversing the radix tree
Freeing all the process memory requires the kernel to walk the entire page table hierarchy. On my laptop, where the OOM happens at around ~12 GiB usage, we’re talking about a radix tree of over 3 million elements.
2. Duplicated work
On top of that, the kernel seems to do it twice for each mmap’ed region when the OOM killer is involved! unmap_page_range is called twice; once from __oom_reap_task_mm, and once from unmap_vmas:
3154 /* Release all mmaps. */
3155 void exit_mmap(struct mm_struct *mm)
3156 {
[...]
3164     if (unlikely(mm_is_oom_victim(mm))) {
[...]
3181         (void)__oom_reap_task_mm(mm);   // <<<  unmap_page_range is called from here
[...]
3186     }
[...]
3206     /* update_hiwater_rss(mm) here? but nobody should be looking */
3207     /* Use -1 here to ensure all VMAs in the mm are unmapped */
3208     unmap_vmas(&tlb, vma, 0, -1);      // <<<  unmap_page_range is also called from here
[...]
While we are taking an extreme example, it may still be desirable (?) to address this in the kernel - maybe other legitimate factors can make unmap_page_range slow on both invocations? In case kernel developers are reading this: I’d be curious to hear your thoughts on this :)
3. Iterating like there is no tomorrow
But the elephant in the room is definitely zap_pte_range, which seems to accumulate most cycles.
Let’s look into why, in mm/memory.c:
1213 static unsigned long zap_pte_range(struct mmu_gather *tlb,
1214                 struct vm_area_struct *vma, pmd_t *pmd,
1215                 unsigned long addr, unsigned long end,
1216                 struct zap_details *details)
1217 {
[...]
1233     do {
1234         pte_t ptent = *pte;
1235         if (pte_none(ptent)) // <<< This is always hit 512 times,
1236             continue;        //     regardless of how many PTEs are present!
[...]
1319     } while (pte++, addr += PAGE_SIZE, addr != end);
Our code only populates a single PTE per table (out of 512 possible), but the kernel does not keep track of that. Therefore, it has to blindly iterate 512 times - such an overachiever!
Assuming the OOM killer kicks in at around ~12 GiB, that approximately amounts to (512 / 4096) PTEs per byte * (12*1024*1024*1024 bytes) = 1,610,612,736 iterations.
It means the kernel has to iterate ~1.6 billion times. And remember: it does it twice!
4. Freeing the radix tree
There’s another set of traces starting at free_pgtables which is clearly expensive to run.
This is the code that frees the pages that were allocated for the radix tree, and there’s indeed a lot of them to free: 12*1024*1024 / 4: about 3 million.
5. OOM killer rampage
Finally, seeing an OOM-killed process taking its sweet time to exit seems to occasionally infuriate the OOM killer. It needs to reassert its dominance by terminating other well-behaved processes15. Chaos ensues.
The text editor in which I am typing this got terminated by the OOM killer, followed by my window manager. Well, it’s impossible to work in these conditions, we must do something about that.
Transparent Huge Pages: encore
I didn’t intend to write so much on transparent huge pages, but they seem to have a lot of entertainment value!
Remember how we left things off with transparent huge pages? There was an unexplained ~2 seconds difference in execution time.
Let’s finally remedy to that and look at a flame graph for the same program for its full duration, but this time with THP enabled:
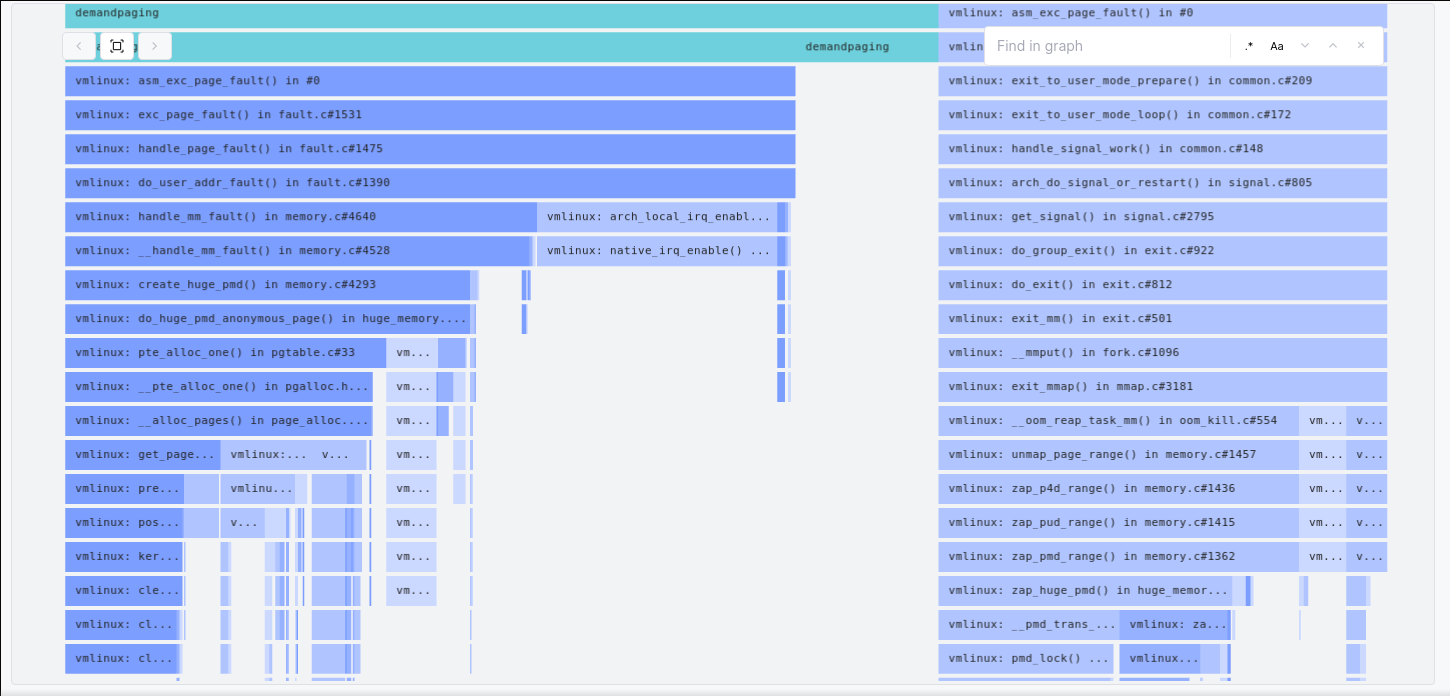
Clearly, the “very slow exit” problem is significantly mitigated with THP enabled:
zap_pte_rangeis never invoked. It is replaced withzap_huge_pmdwhich is far more efficient, as it doesn’t need to iterate over the 512 PTE slots. This is possible because while a PTE exists, the PMD is marked with a flag16 that indicates a huge page.unmap_page_rangeis still called twice, but the second invocation is much cheaper, as the first invocation clears all the PMDs from the tree17, something the non-THP counterpart did not do.
In summary, enabling Transparent Huge Pages makes the kernel take a different code path on process exit. The main difference being that the THP code path does not iterate on 3 billion PTE slots!
This explains why enabling THP makes the program run faster. It won’t exhaust memory faster, but it will ensure memory can be reclaimed faster on exit.
Conclusion
Profilers, useful multi-tools
I hope this little expedition in virtual memory land was entertaining and informative! At first glance it is definitely not an easy code base to get into, or to experiment with (and to write about!). And generally speaking, diving into a complex code base like the Linux kernel may feel like solving a chicken-and-egg problem: reading code is needed to develop intuition, but intuition is too quickly needed to look at the right places in the code - especially in code bases that make heavy use of function pointers, like Linux.
Without prior knowledge, it is sometimes necessary to make code changes (debug logging, …) or to attach a debugger to observe various behaviors. However, this process can take a lot of effort before it pays off, due to the up-front cost of setting up a harness for experimentation (which of course includes splattering printf("hello123\n") all over - I see you, my fellow printf sweethearts).
But in such situations, a profiler can sometimes provide some sort of blueprint for analyzing a code base, and a hands-on learning mechanism with a lower entry barrier. In this case, no kernel was recompiled in the making of this article! This is a good property for such tooling - ultimately, profiling is not just about performance, it’s also a great tool for general code base visibility. And something that can help your new teammates to get a feel of how things work.
In this article, we’ve explored a chunk of the Linux virtual memory management subsystem. Looking at symbolized CPU profiles while experimenting with various parameters unlocked a lot of information (and more questions!). I personally like this way of learning, as it helps develop an intuition without having to read too much code.
Profile All The Things!
Good tools matter. In this article we’ve used Prodfiler18 to profile the kernel through our little abomination of a program, and it should hopefully be easy to replicate the experience. Among other things, Prodfiler aims to make profiling easy and accessible (and hopefully fun :) ).
But prod is often the only place that looks like prod, so it is also designed to be production-safe and always-on: running on production infrastructures, it will continuously bring the same kind of operational knowledge & learning opportunities.
If any of this speaks to you, feel free to sign up and check it out - you might also learn a few things you don’t expect :) But hey, playing with awesome tools like perf is also great way to learn.
In the meantime, feel free to contact me at @vic_mic_ - feedback, remarks and questions welcome!
Thanks for reading!
Mentions
- Special thanks to Mark Mossberg (blog) for all the feedback on the draft!
- The perf tool and its contributors also need to be mentioned here. Counting page faults, dTLB misses and page walk cycles has been a big help :)
Appendix A: Profiling & interrupts requests
While not critically important to understand most of this article, let’s dig into why native_irq_enable looks like its consuming a lot of CPU cycles.
We’re using a sampling profiler to gather the above data. It works by firing software IRQs (interrupt requests) regularly, asking each CPU core to report the stack trace of the program it’s currently executing.
However, CPU cores are often already busy handling other IRQs, or executing code that must not be interrupted by such an IRQ. When that happens, IRQ handling is disabled19 on that CPU core, and as a result, sampling is temporarily suspended20. Sampling eventually catches up as soon as IRQ handling is re-enabled, which means the time spent with IRQ handling disabled is usually accounted for in code paths that re-enable IRQs - like native_irq_enable.
This naturally makes kernel stack traces a bit “sticky” to places where IRQs are re-enabled after expensive operations that happened with IRQs disabled. Note that this won’t affect the userspace portion of the profiles.
A page fault is an example of such an interrupt request21. It is triggered by the MMU (memory management unit), signalling the kernel that program execution cannot continue until the kernel handles the fault. Consequently, sampling is temporarily suspended when the page fault is raised. It is then the kernel’s job to eventually re-enable IRQ handling when safe to do so.
Ultimately, interrupt handling is a complex subject worthy of a whole book chapter, so don’t worry too much if the above is unclear22.
Appendix B: A crime against common sense
This is an addendum to the section To infinity NaN and beyond, where we noticed that madvise with MADV_FREE does not cause page table memory to be released.
In a bizarre twist of fate, we can actually get the kernel to release some page table memory using madvise, assuming both of the following conditions are met:
MADV_DONTNEEDis used, instead ofMADV_FREE.- Our most loyal friends, Transparent Huge Pages, are enabled.
Running the program under these conditions causes memory to stagnate at ~512 MiB, as the page tables (leaf level in the radix tree) are freed by the madvise calls. Especially, the program does not OOM anymore.
Looking at the madvise man page, we read:
MADV_DONTNEED
Do not expect access in the near future. […]
Hmmm, isn’t it a little surprising & funny that MADV_DONTNEED ("Do not expect access in the near future") does in fact free page table memory, while MADV_FREE (“The application no longer requires the pages") does not?
Well, it definitely is! It is the result of 2 things:
- The THP code path in
zap_pmd_rangecauses PTEs to be freed, while the non-THP path does not. This is the exact same behavior we’ve seen in an earlier section. - We are in parallel universe #6548432586571, where a bogus implementation of
MADV_DONTNEEDfrom the now-defunct Tru64 UNIX operating system made its way (in spirit) into the Linux kernel!
You can hear Bryan Cantrill energetically protest about the latter in the following video (recorded back when MADV_FREE didn’t exist yet in Linux), in a talk titled “a crime against common sense” - yep, I didn’t make that one up :)
-O0to avoid the loop to be optimized away, and-staticto avoid mappings from shared libraries to overlap with the large requested address space. ↩︎It is possible to monitor page table usage by looking at
VmPTEunder/proc/<pid>/status. ↩︎It maps to a single assembly instruction: sti. See https://www.felixcloutier.com/x86/sti ↩︎
We could leave
READ_INTERVALat4 * KBthough, it wouldn’t make much of a difference. Leaving it at 4 KiB might trigger up to 510 additional page faults since the mmap’ed region is not necessarily aligned at a 2 MiB boundary - marginally preventing the use of huge page mappings. ↩︎There’s indeed another dedicated “shared zero page” when transparent huge pages is enabled. It is 2 MiB large. There’s a kernel config parameter to disable it (
/sys/kernel/mm/transparent_hugepage/use_zero_page), but in practice it should be enabled by default. ↩︎https://lwn.net/Articles/619738/ also gives additional context. ↩︎
Something that is probably obvious to people familiar with OS development or CPU design. I’m neither of these :) ↩︎
# echo never > /sys/kernel/mm/transparent_hugepage/enabled↩︎Acute readers may have noticed that the 1024x improvement wouldn’t actually hold if we were comparing overheads for larger quantities of memory (16 GiB instead of 1 GiB, for example). But hey, it’s not my fault if Mark only had access to 1 GiB of RAM! ↩︎
“PTE” in
VmPTEis overloaded - here it refers to all levels of the page table hierarchy, not just the (leaf) PTEs. ↩︎Such an algorithm has a very poor property if the actual goal is performance: cache locality on page table reads is sacrificed. For example, there’s very little chance for the right PMD to be present in the CPU cache when the MMU does page table walks, because the previous walks would have been for virtual memory regions that are tracked very far away in the radix tree. This can be observed indirectly with
perf stat -e dtlb_load_misses.walk_pending, measuring the number of CPU cycles spent on page walks. In that sense, this algorithm isn’t always optimal and will actually be slower than the more naive approach depending on the parameters (like the amount of memory necessary to go OOM). To solve this we’d probably need to revert to a linear scan after all the page directories are allocated. I did not develop this point as I wanted to focus more on the kernel side of things. But there might be much more to be said about this - feel free to complete the blog trilogy :) ↩︎We can’t use
munmapas it has to be used sequentially, and our top-down algorithm does not do sequential reads. ↩︎If you are trying this, note that you’ll also to ensure that each address passed to
madviseis aligned at the page boundary. ↩︎Notably, Golang 1.12-1.15 used
MADV_FREEto release memory, though it was dropped in 1.16 as it makes RSS values undependable. ↩︎I am actually speculating here, but it seems to be the case empirically - I can’t reproduce this OOM killer behavior with processes that exit quickly. ↩︎
The flag is
_PAGE_PSE, PSE meaning “Page Size Extension”. Seearch/x86/include/asm/pgtable.h. ↩︎zap_huge_pmdinvokespmdp_huge_get_and_clear_fullwhich erases the PMD, and invokeszap_deposited_tablewhich in turns frees the page table. The next invocation has nothing left to look at. ↩︎Shameless plug! https://prodfiler.com/ ↩︎
Disabling IRQs can either be done explicitly by the kernel, or directly by the CPU, for example through the interrupt gate (see Intel’s software developer’s manual section 6.8.1) ↩︎
This is not a general statement about profilers. For example, in non-virtualized environments, or environments with enough control over the CPU, perf can use NMIs (non-maskable interrupts) from hardware performance counters to trigger sampling, which will preempt other IRQs. ↩︎
This is technically incorrect, but I prefer not to introduce more concepts that are not particularly relevant to this article. Folks who are more well-versed into the subject may rightfully point out that from a CPU perspective, page faults are “exceptions”, not interrupts. The term “interrupt” is a little overloaded here. What matters is that x86 exceptions (including page faults) are signalled through the CPU’s “interrupt gate” on Linux. The interrupt gate will clear the IF flag - the same flag used to mask IRQs - and that’s all we care about. ↩︎
Also keep in mind that I’m not quite the expert on the subject. Please feel free to send corrections! ↩︎