Optimising an eBPF Optimiser with Prodfiler
In this blog post I will walk through how we can use Prodfiler to unearth areas for optimisation in K2 (paper, video), an optimising compiler for eBPF. K2 is entirely CPU bound and uses a guided search technique that relies on the ability to create and check candidate solutions at high speed. With Prodfiler we can easily discover which components of K2 consume the most CPU cycles, allowing us to optimise them accordingly. The end result is a version of K2 that is 1.4x-1.9x faster, meaning it can explore a significantly larger search space given the same resources.
To foreshadow where we are going, the improvements discovered come from:
- Replacing the system allocator with better performing alternative, namely
mimalloc. - Assisting the compiler in auto-vectorising a series of hot loops.
- Applying PGO and LTO to K2 itself and to Z3, its most significant dependency.
Onwards!
Introduction
As more use-cases are discovered for eBPF, with many of them on critical paths, the performance of the eBPF code generated by compilers is increasingly important. While clang usually does a good job of producing efficient programs, it sometimes generates code that suffers from redundancies, unusual choice of instruction sequences, unnecessarily narrow operand widths, and other quirks that mean a hand-optimised program can be significantly faster. Hand-optimisation of eBPF instructions is challenging, time consuming and error prone and so, as with compilation for more traditional target platforms, there is a market for tools that spend time upfront in compilation in order to gain performance at runtime.
In August of this year, researchers at Rutgers released K2, an optimising compiler for eBPF code. K2 takes as input an existing eBPF program and searches for a faster and smaller program that is semantically equivalent to the original. In their paper they demonstrate that their approach can be used to reduce program size by 6-26%, lower the average packet-processing latency of those programs by 1-55%, and increase throughput by up to 5%, relative to the best clang-compiled programs.
To drive its search K2 uses MCMC with the Metropolis-Hastings acceptance criteria1. A good introduction to MCMC/MH can be found here, but for our purposes it’s sufficient to just think of MCMC as a search technique that, in its inner loop, must generate a new candidate from the current state and assign a cost to it. The next current state is then decided upon randomly using the costs of the current state and the candidate state to bias selection. Given a fixed time budget (and assuming sane candidate generation and a reasonable cost function) the quality of the result is directly linked to the number of states that can be explored in that time period. MCMC-based applications are thus prime targets for tools like Prodfiler, as any performance gains that we can eke out are likely to enable the application to find higher quality results using the same resources.
A Brief Overview of K2’s Architecture
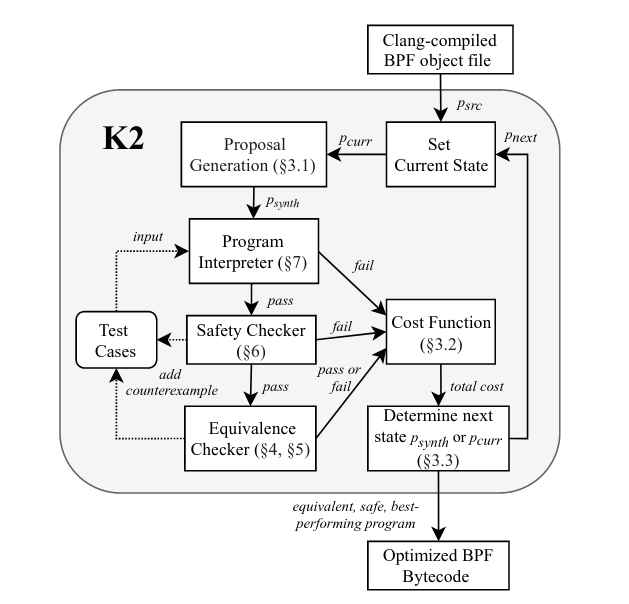
For some context on what exactly we will be optimising, lets quickly run through the components of K2. The above diagram is from the K2 paper, which is very readable and highly recommended if you’d like more detail.
As mentioned above, being MCMC-driven, the core of K2 is:
- Generate a new candidate from the current state.
- Assign that candidate a cost.
- Set the current state to new candidate state, conditionally on the candidate’s cost and the current state’s cost.
Algorithmically, almost all of the heavy lifting goes on in step 2. To calculate the cost of a candidate, K2 interprets it using a custom userspace eBPF interpreter on a set of inputs. For these inputs, if the candidate produces the same outputs as the original program, K2 then converts the candidate to a symbolic representation and uses the Z3 theorem prover to perform an equivalence check. The inner loop of the MCMC search is therefore computationally quite intensive, with each candidate requiring a significant amount of work to evaluate.
Setting Up
Setting up Benchmarks
K2 itself can be found on GitHub, and conveniently the authors have also uploaded a conference artifact containing tests and benchmarks that were used to generate the results in their paper. I have cloned this repository here in order to add some helper scripts for use in this post. The primary K2 repository is a bit scant on information on how to actually install and run it, but fortunately there is an installation script here, which one can follow as required. An example of how to run K2 to optimise an eBPF program can be found in this script. That script will invoke K2 on 11 different eBPF programs to try and find more efficient implementations. We will use it as the basis for our benchmarks as the input eBPF programs are diverse, and we can be relatively certain that if we find optimisations that make K2 run faster across these input targets, then they should generalise.
One final point on setting up the benchmarks is that I have cloned K2 here in order to provide a default Makefile that will build a reasonable binary for us to compare our improvements against. The standard Makefile that comes with K2 appears to have an error, and does not specify an optimisation level when compiling most files that make up the program, and thus by default you get no optimisation and quite poor performance. My Makefile specifies -O3 -march=native as a default.
Benchmarking and Optimising with Prodfiler
Getting started with Prodfiler is straightforward. Follow the docs here to create a new project and deploy Prodfiler in a few clicks. Once it is up and running we can then gather our baseline data by running the benchmarks mentioned above. The script I have created to do so can be found here. By default it runs each of the 11 benchmarks 15 times. We’ll use that to gather our results and ensure our optimisations generalise, but there’s also a ‘fast’ mode that runs 3 of the benchmarks 3 times each, which can be useful for quickly checking a hypothesis.
Act I - Where the M and C in MCMC stands for MalloCMalloC
Opening the Top N Functions view of Prodfiler gives us the following (hint: Exclusive CPU means the CPU usage of the function alone, excluding the CPU usage of the functions it calls. Inclusive CPU means the CPU usage of the function itself and the CPU usage of the functions it calls).
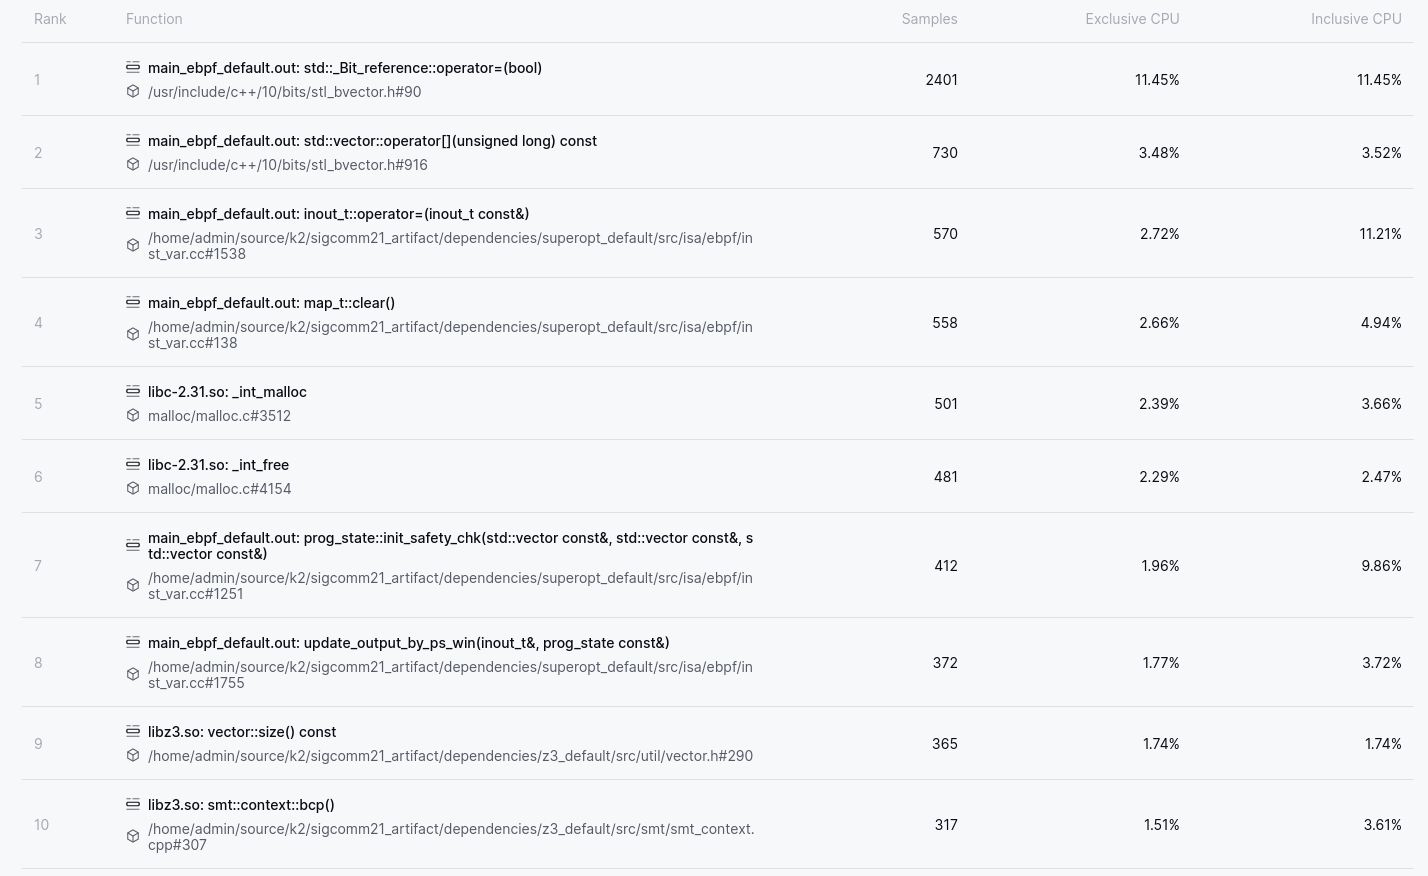
The Top N Functions view is my usual starting point to get a feeling for where an application is spending its time. Fairly often one or more entries in the Top 10 Functions will make me think “Huh, that’s weird”, and provide a clue as to potential performance wins. This view is particularly good at surfacing functions where each individual execution is cheap, but the function is called so often that it comes to unexpectedly dominate execution time.
Two things in particular stand out in the Top 10 Functions of K2. The first is that a significant amount of time is spent assigning and retrieving items from an STL container. Based on the function names and the source file in question we can deduce that the container is a std::vector<bool>, a notoriously weird container. A std::vector<bool> can be the right choice in situations where memory usage is a concern, but if one is primarily concerned with CPU usage then there are better options. OK, that’s a good start, but lets park it for the moment and continue down the list and see if there are even easier gains to be found.
The second item that stands out is that in positions 5 and 6 we can see the malloc
and free functions. In fact, upon expanding the above list to encompass the top
20 functions, I discovered that malloc-related functions take up 5 out of the top
20 spots. If we sum their CPU usage we learn that a full 10% of the
application’s CPU time is spent on memory management! Applications that spend so
much time in memory management can almost always be sped up in two ways. One
approach is to analyse the application’s usage of memory, and try to tune that
to simply make fewer calls to the memory management functions. The second
approach is to swap out the system allocator with something
else. The latter
approach is usually far less work2, and is what we will go with here. There are
many choices of allocator these days, with jemalloc and tcmalloc being
particularly well known. A more recent entry into the field is
mimalloc. In benchmarks, mimalloc compares favourably with the other
available options, and is our choice for this post.
mimalloc is a drop-in replacement for the system allocator. Using it is as simple as adding its installation location to LD_PRELOAD and running your application.
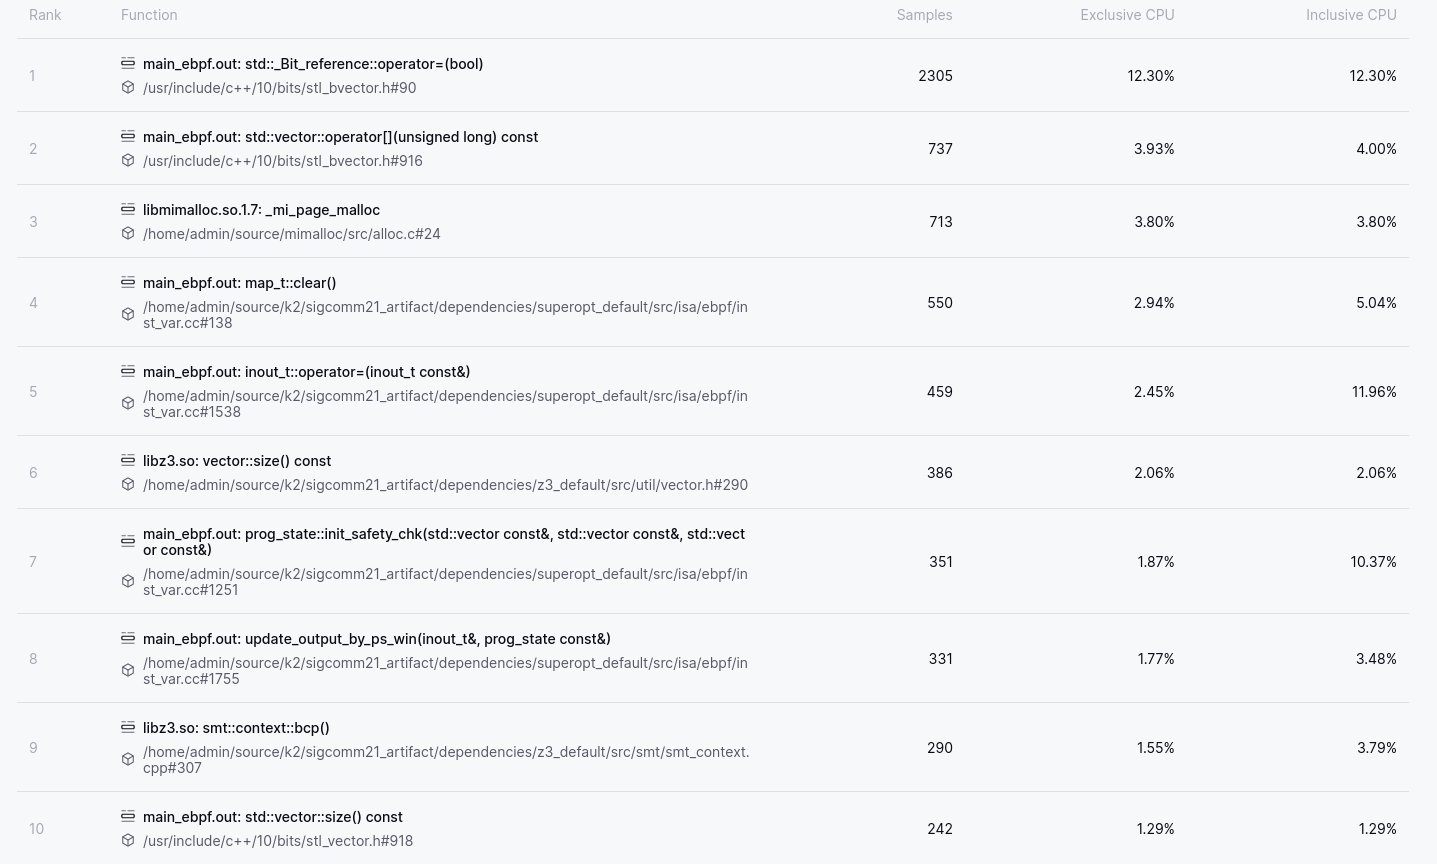
With this change we can see that the free function has dropped out of the Top 10 Functions entirely, and if we sum the usage of all functions in mimalloc we find that memory management has dropped to approximately 5%, instead of the 10% it was at previously. Excellent! That’s 5% of the CPU budget that will now hopefully be allocated to more useful things.
So, what sort of performance gain do we get from this? The following chart shows the mimalloc runtime versus the default runtime. The X-axis shows the speed-up of the mimalloc run as a factor of the default run. Note: The Y-axis is truncated starting at 0.8, to make it easier to see size of the changes.
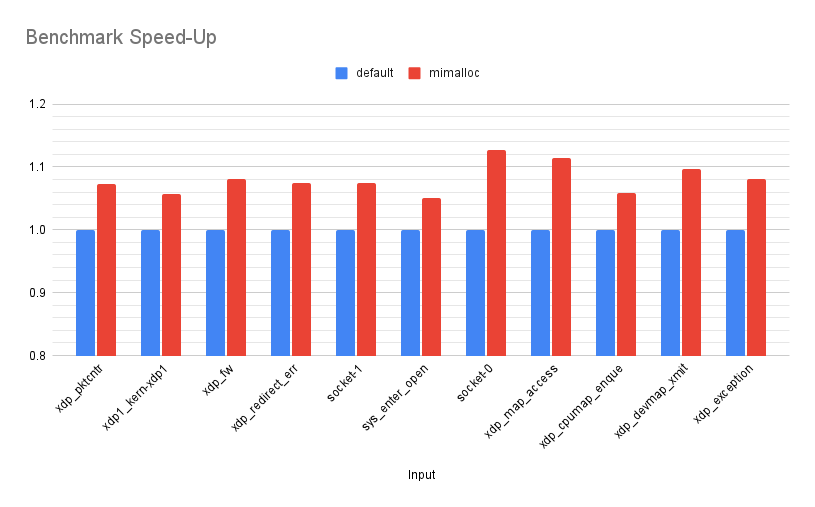
Across the benchmarks we see an average speed-up of 1.08x, with a min of 1.05x and a max of 1.12x. Not bad for a zero effort change, but lets see what else we can find!
Act II - In which std::vector<bool> murders performance
With the easiest of wins out of the way, we may now have to do some actual work.
Fortunately, we have a clear starting point.
Returning to the Top N Functions we can see that the top two items alone account
for 15% of the CPU budget, and are related to access to std::vector<bool>
containers, as mentioned previously. That is a fairly extreme proportion of CPU
budget to be allocated to any one built-in data-structure, and my expectation in
such scenarios is that there are gains to be had. First, we need to figure out
what std::vector<bool> is being used to represent, and how it is being used.
To answer this question, Prodfiler provides a call-graph for each function which
can be accessed by clicking on the function name in the Top N Functions view (or
by ctrl-clicking on a function in the Flamegraph view). The call-graph for
std::vector<bool>::operator= looks as follows:
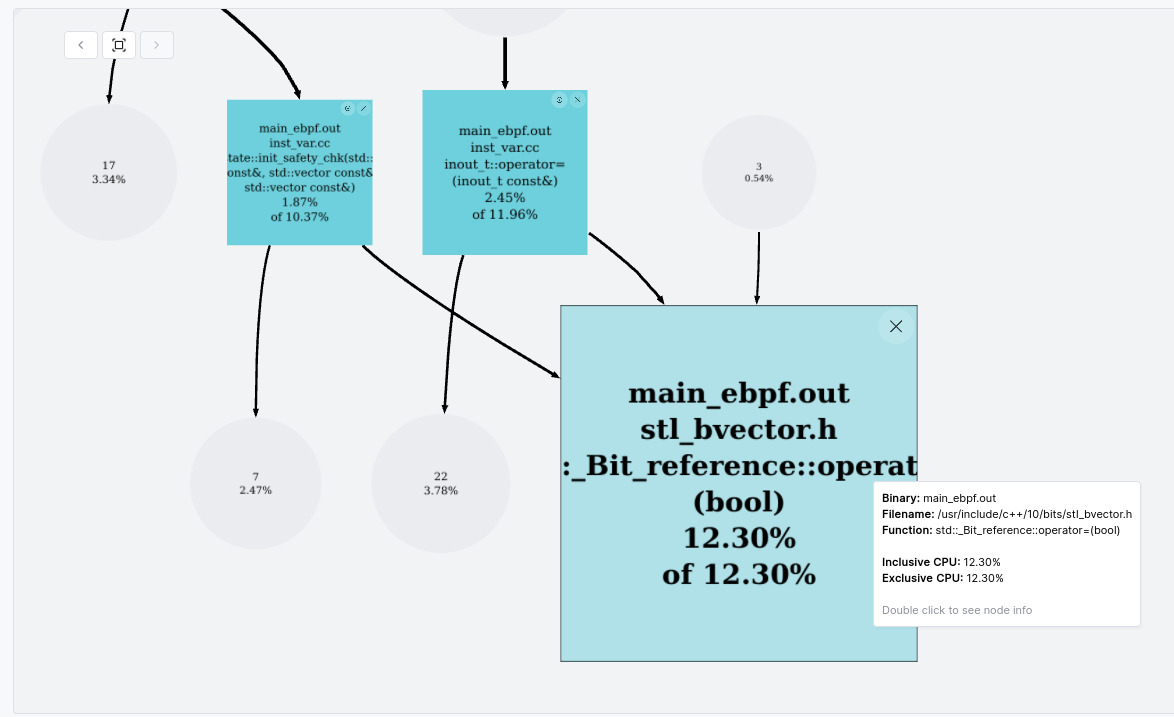
We can see that two functions (prog_state::init_safety_chk and inout_t::operator=)
are responsible for practically all of the calls to this function. These same
two functions are also responsible for all of the calls to
std::vector<bool>::operator[], the second function in the Top N Functions
list. Armed with this we can jump into the code to try and figure out why so
much time is being spent operating on these vectors, and what we can do about
it.
The init_safety_chk function is as follows (source):

So we have a series of bools being copied about on each safety check of a
candidate. The two containers representing whether a register is readable and
whether memory is readable are of fixed size, 11 and 512 respectively. Looking
at the code for inout_t::operator= we see a similar
pattern. The copies in inout_t::operator= will have more of an impact than
those in init_safety_chk as this assignment operator is
called in the
calculation of the error cost for a candidate the same number of times as there
are concrete inputs available on which to interpret that candidate.
Given that these vectors are of fixed size, and in principle at least should contain very little data one might wonder why we are spending so much CPU on copying them, even if the copies do happen multiple times per candidate. On a CPU with SIMD instructions, shouldn’t copying around this amount of data just be a matter of a loop-free block of instructions each time? Well, lets see what the compiler does with that code. Note: The disassembly screenshots in this post are not from Prodfiler, but from Binary Ninja.
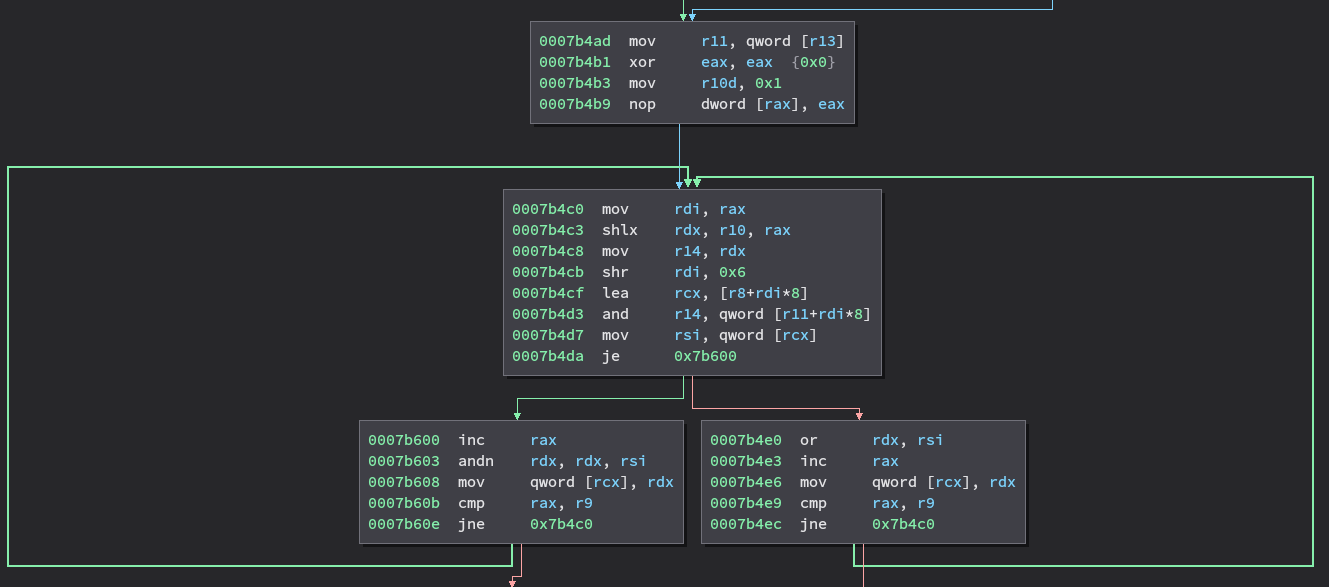
The above code is generated to copy the contents of the stack_readable vector.
As we can see, we certainly don’t have a straight-line sequence of SIMD
instructions, but instead a loop with a branch in the middle that will iterate
STACK_SIZE times. The reason for this becomes obvious if we have a look at
the implementation of operator= in stl_bitvector.h:
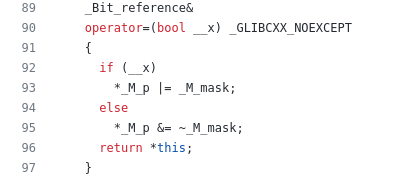
OK, so clearly the compiler isn’t going to be able to help us out here and
nicely vectorise that automatically. So what are our options? Well, K2 does not
have a very high memory footprint, and the memory savings from using
std::vector<bool> instead of, for example, representing the same information
as a vector of bytes, are not significant in the grand scheme of things. My first
thought was to simply replace the bool type with a uint8_t. However, upon doing so
and rerunning the benchmarks the performance improvement was paltry, and nothing
like what I would have expected if a byte-by-byte copy such as the one above was
replaced with straight-line SIMD. Back to the disassembly we go, and discover
that the copy loop has become the following:
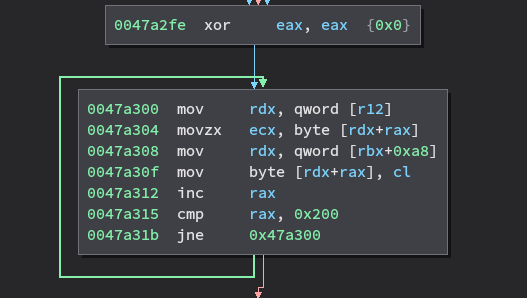
For some reason, instead of straight-line SIMD the compiler has decided to
produce a byte-by-byte copy loop in which on each iteration the source and
destination pointer are loaded from memory. I asked about this on Twitter and
Travis Downs responded and pointed out that the issue is that
in C++ the uint8_t type can alias all other types! Therefore the compiler
cannot guarantee that each write to the vector does not modify the source and
destination pointers, and thus must reload them from memory on each loop
iteration. Travis has an excellent blog post that further expands on this
here.
Travis had a number of suggestions for ways to hack around this issue, and the
one I decided to go with was to use C++20’s char8_t type instead of uint8_t.
This type does not have the aliasing problem, and gives us our desired straight-line SIMD code:
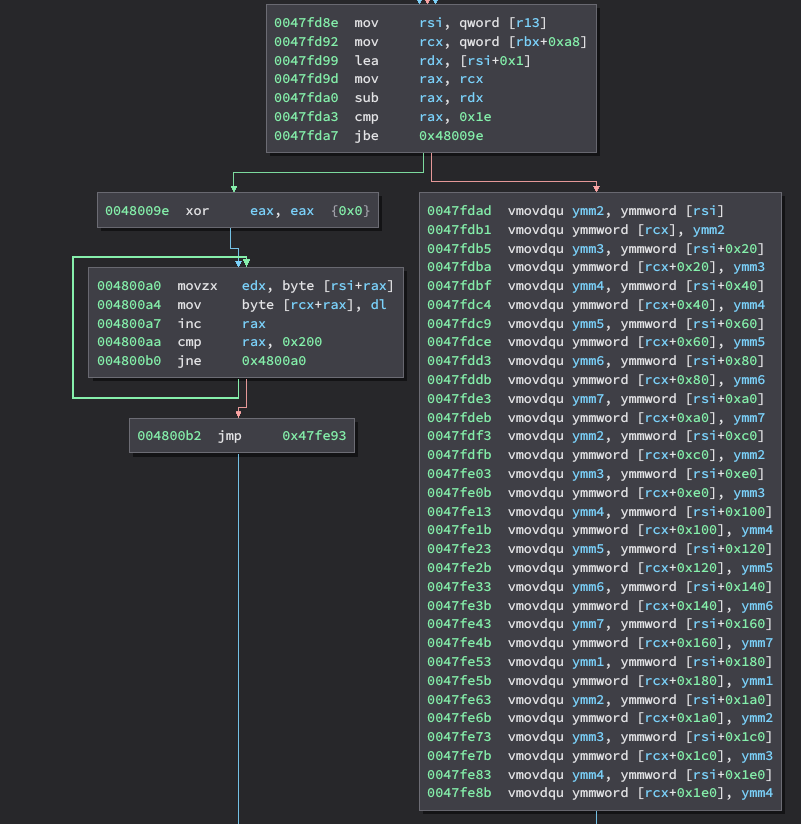
As you can see on the left-hand side, there is also code generated to do a byte-by-byte copy, but this will never be reached in practice as it is only entered if the source and destination vectors overlap. So, how does this help our performance?
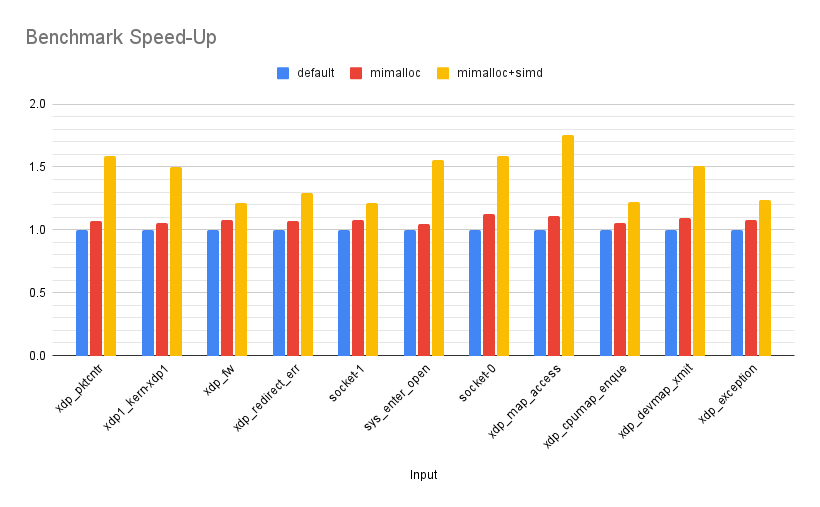
Rather well, it turns out! By replacing the vector<bool> with
vector<char8_t> and enabling the compiler to auto-vectorise the relevant loops
we have an average speed-up of 1.31x over the mimalloc version, with a maximum
of 1.57x and a minimum of 1.12x. Over the default version, we now have an average
speed-up of 1.43x, with a maximum of 1.75x and a minimum of 1.22x.
Looking at the Top N Functions view we can also see that operator= and
operator[] are now 0.82% 0.62% of the total respectively, down from 12.3% and
3.93%3.
What this means in practice is that with a 1.22x-1.75x speed-up, given the same
CPU budget K2 can perform a significantly larger search. Concretely, in the
benchmark with the most significant improvement (xdp_map_access) by default K2
can explore approximately 4600 candidates per second, but with our improvements that has
jumped to approximately 8000 candidates per second!
Act III - Z3
An average speed-up of 1.43x is nice, but before wrapping up lets have one last look at the profiling data, to see if anything else stands out.
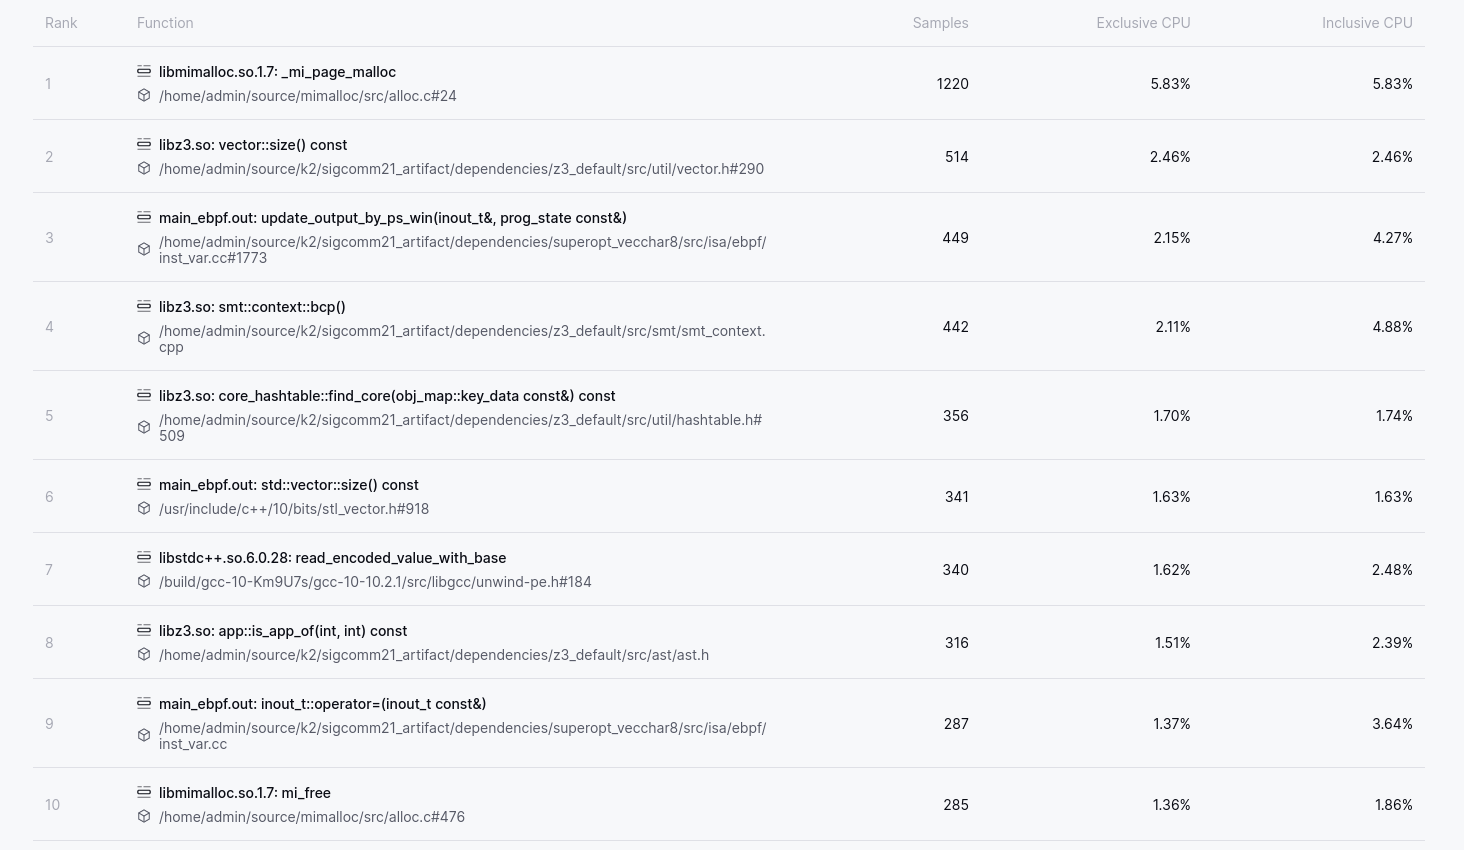
A glance at the Top N Functions shows us that memory management functions remain
significant, with around 7.5% CPU across malloc and free (positions 1 and
10). There are a few directions we could take with this, including reviewing
K2’s memory allocation patterns to see if they are sub-optimal in some way, or
potentially applying PGO/LTO to mimalloc in the hope of making it faster. The
former option is likely to be a bit of work, and the latter option I felt would
be unlikely to give more than a couple of percentage points in improvement. The
function in position 7 is also interesting in that from the callgraph we can see
that read_encoded_value_with_base is used as part of C++ exception handling.
Looking into the code shows that K2 uses exceptions as mechanism to communicate
non-fatal errors from deep in the call-stack to higher up functions. We could
rewrite this to use return values or output parameters to indicate the same
information and save on this overhead, but again this is likely to be a decent
amount of work for not a lot of gain. The final observation I have
from this data is that 4 of the Top 10 functions are in Z3, and it is this one
that we will dig into as it gives a hint that any optimisations to Z3 are likely
to have a significant impact.
Prodfiler provides two ways to dig into how these functions are used. The first is the callgraph as we saw earlier, and the second is the flamegraph, which we will use now. The flamegraph is quite useful when one wants insight into the most costly call-stacks, in a more information dense and easily navigatable fashion than a callgraph (at the expense of not representing the sum totals of CPU usage associated with each function, but instead representing data per call-stack).
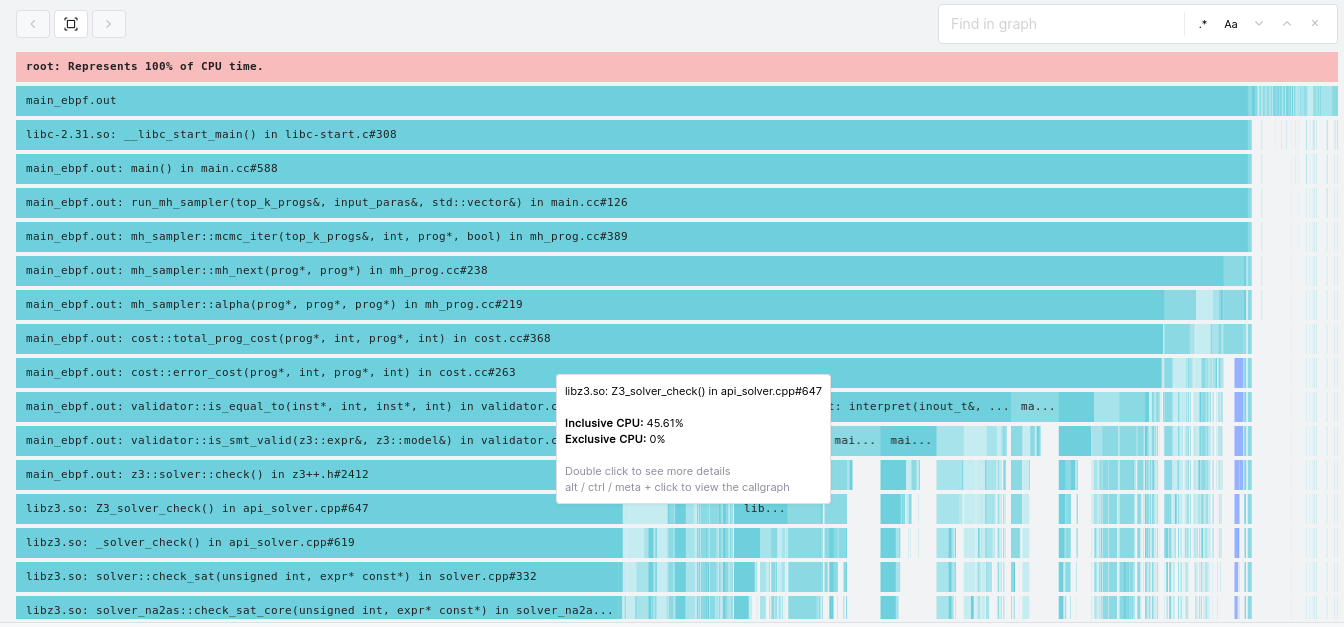
The flamegraph confirms our hypothesis that Z3 is a worthy target for
optimisation. We can see in the graph that the Z3_solver_check() function and
its children are responsible for a full ~46% of the work done by K2! There are two ways
we could attack this:
It is possible that K2 is calling Z3 more than it needs to. If you recall from earlier, Z3 is only called if K2 fails to distinguish a candidate program from the original program via interpretation of that program on a set of inputs. It is possible that by generating a more diverse set of inputs we could distinguish candidates from the original without going to Z3 as often.
We could attempt to make Z3 itself perform better.
Given enough time we would most likely do both (1) and (2), and possibly even start with (1). However, by this stage I was starting to enjoy the challenge of trying to improve K2’s performance by making the least intrusive changes possible and so decided to go with (2) alone. Now, improving Z3, one of the most powerful and popular theorem provers in the world, would actually be a lot more work than option (1) if we actually wanted to do so by making algorithmic or implementation changes. We have another option available to us though: modifying the manner in which Z3 is compiled.
Both gcc and clang support Profile Guided Optimization (PGO) and Link Time Optimization (LTO)4. PGO and LTO are complementary and using both one can often get performance improvements in the range of 5-20%, with high single digit improvements being a reasonable expectation. For various reasons very little open-source software is distributed compiled with PGO/LTO, or even comes with a build target that will enable them (although this is changing). Fortunately, it’s usually straightforward to do it yourself5.
PGO is a three-step compilation process in which one first builds an
instrumented6 version of the application, then runs that application on a
series of inputs in order to gather data, and then finally recompiles an
optimized version of the application using that data. For the first phase I
randomly selected three benchmarks (socket-0, xdp_kern_xdp1 and xdp_cpumap_enqueue)
and ran each three times. These three benchmarks are included in the below
graphs, but it is worth keeping in mind that there is a potential for
over-fitting7 to their characteristics which may mean one would
want to discount the results on those and focus on the others. In the
computation of the various min/max/mean values below I have excluded them.
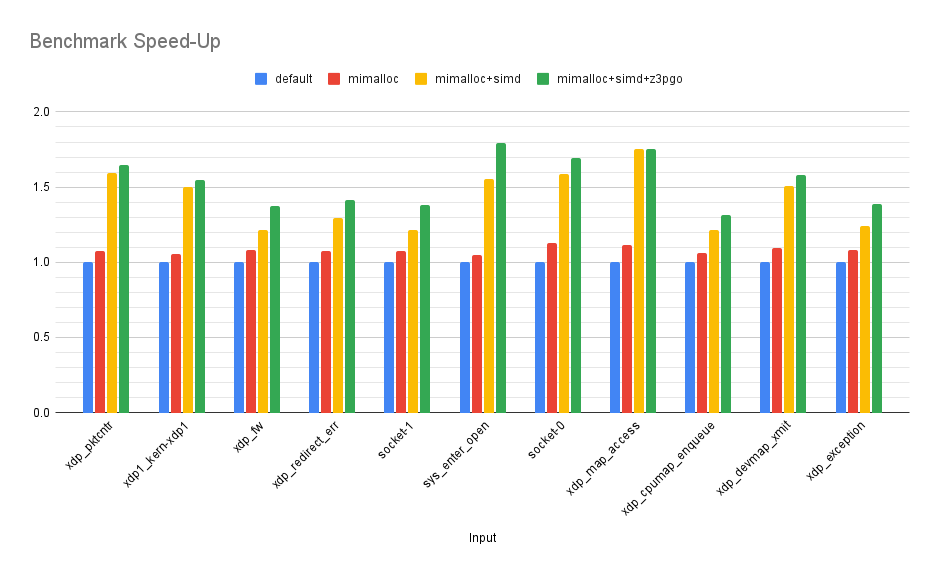
Applying PGO and LTO to Z3 has gained us on average 1.1x performance impovement over our previous version, with a max of 1.17x and a min of 1x (identical performance as before). Overall, that brings us to an average improvement of 1.54x over the original version, with a min of 1.37x and a max of 1.79x!
As a final effort I decided to also then PGO (but not LTO8) K2 itself to give our final results:
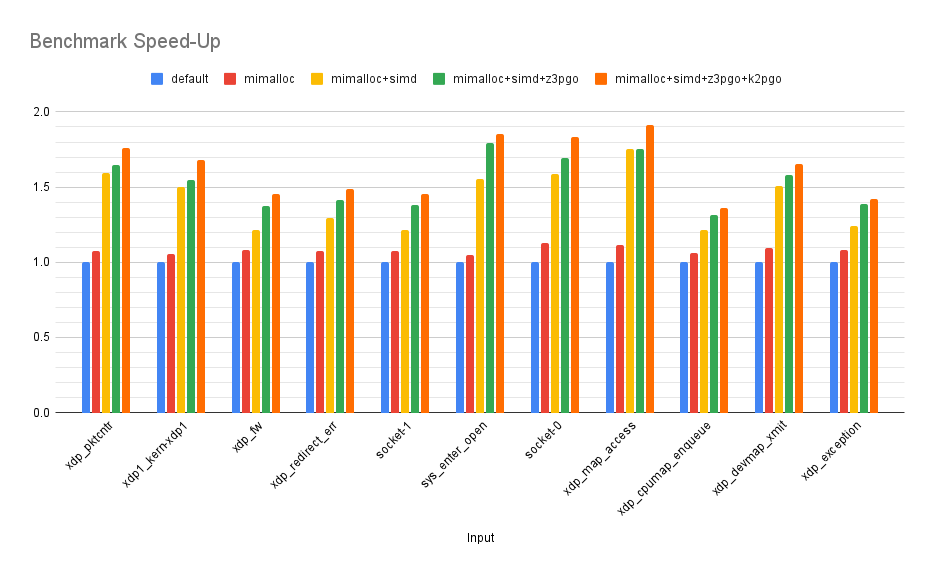
PGO’ing K2 itself was good for another 1.03x performance gain on average, with a max of 1.09x and a min of 1x. These are modest improvements, but it is worth keeping in mind that on average 44% of the execution time of K2 is actually spent inside Z3, and so there is only so much that PGO’ing the rest of the code can do.
So, in the end, after swapping in mimalloc, replacing std::vector<bool> with
std::vector<char8_t> and applying PGO/LTO, we have an average performance
improvement of 1.62x, a maximum of 1.91x and a minimum of 1.42x. In practice
what this means is that if we were exploring 10,000 states per second originally,
on average we are now exploring ~16,000 in the same time budget, and in the best
case we exploring almost twice as many!
Conclusion
In this post we have walked through how Prodfiler can be used as part of an iterative process to significantly increase application performance. The sequencing in this post is how I actually use Prodfiler - (1) set up benchmarks (ideally real workloads; Prodfiler’s overhead is low enough that this is feasible), (2) run them, (3) and then iteratively work through the top functions, flamegraph and callgraph, seeking out changes to the application itself, the environment, third party dependencies, or configuration, that can increase performance.
I view Prodfiler as a “Huh?"-generator, in that its various views tend to induce a “Huh - that’s weird” thought in my brain that is the first step along a path to figuring out why exactly some unexpected component is assigned as much CPU as it is. Sometimes the end point of that path is just resolving a misunderstanding of mine about the target software, but often it is discovering some overlooked characteristic that’s eating CPU in an unanticipated way. That is the true value of Prodfiler - it allows precise data to be gathered with zero friction, from individual applications to entire clusters, and visualises that data so that an engineer can easily scan it for “Huh?" moments. So, in conclusion, whether it is Prodfiler or not, I would recommend finding yourself a “Huh?"-generator. In combination with some persistence there are huge performance improvments to be found in the modern software stack. Happy hunting!
You can sign up for Prodfiler here, and if you hit any issues please drop us a question on our community page. Also feel free to just message me directly on Twitter via @seanhn.
This provides a good introduction to MCMC/MH, and the STOKE paper is worth reading for another example of stochastic search in program optimisation. ↩︎
Unless the ‘something else’ you are swapping in is a custom allocator, specifically designed for your application’s memory allocation patterns. That is of course a reasonable approach in some scenarios, but probably overkill unless you have really exhausted all other alternatives. ↩︎
After replacing
vector<bool>withvector<char8_t>in theinout_tandprog_stateclasses and rerunning the benchmarks I saw thatmap_t::clearwas now the second most expensive function, with 3-4% of the CPU budget. Upon looking into it I found another instance ofvector<bool>that was causing the compiler to produce a byte-by-byte loop to zero out the vector. I also replaced this withvector<char8_t>, allowing the compiler to usememsetinstead of the loop. The results shown include the effects of this change as well ↩︎A useful high level overview of both PGO and LTO can be found here. See the documentation of gcc and clang for further information. ↩︎
In a future blog post I’ll go into PGO/LTO of Z3 specifically, but the gcc documentation on the flags
-fprofile-generate,-fprofile-useand-fltoare a good starting point. This StackOverflow post also has some high level information on PGO. ↩︎There is another approach to PGO that uses a sampling profiler instead of instrumentation. The Google AutoFDO paper is a good starting point for information. ↩︎
I am unsure how significant this possibility of over-fitting actually is. K2 randomly generates candidates given a starting state, so even starting from the same state it is likely that the search space explored will not be identical, and thus the use of Z3 will not be identical. ↩︎
LTO’ing K2 resulted in the functions that operate on the
vector<char8_t>types that we introduced being inlined in a variety of locations and for some reason once that happened gcc would no longer unroll and vectorise those loops. I’ll dig into this in a future post. ↩︎
