Introducing Prodfiler

Thomas Dullien
Aug 31, 2021 @halvarflakeToday we would like to introduce Prodfiler, the world’s first whole-system multi-language continuous profiling platform that does not require recompilation, on-host debug symbols, or service restarts. With Prodfiler you can profile everything, all the time, in production. Prodfiler currently supports C/C++, Java, Go, Rust, PHP, Perl, Python, Scala and Ruby, can profile both user- and kernel-space code, can be used in containerised or non-containerised environments, and provides a powerful UI to unearth inefficiencies and optimization opportunities throughout your entire fleet. Sign-up here, read more in our documentation, or ask us questions on our community forum.
Continuous profiling is fast emerging as an important component of observability. A standard feature inside hyperscalers since approximately 2010, the technology is slowly percolating into the wider industry.
As recently as 2-3 years ago, almost no continuous profiling products existed. As of 2021, there is a plethora of APM vendors and other projects that provide some form of continuous profiling.
Unfortunately, these solutions have many shortcomings in practice:
- They often rely on per-app instrumentation, requiring each team to make changes to their app.
- Most of them require service restarts.
- Few of them have a broad coverage of different language runtimes.
- Support for native code (C/C++/Rust) is often poor, and requires either recompiles with frame pointers and/or debug symbols on production machines.
At optimyze, we set out to bring the benefits of continuous profiling to a broad audience, so we set out to create a continuous profiler that “just works”: Given a fleet of hundreds or thousands of nodes, just deploy it, and get profiling for all applications running on the fleet immediately.
No frame pointers needed, no debug symbols needed
One of the big hurdles to profiling is that upstream dependencies are often compiled with frame pointer omission – a particular compiler feature that complicates unwinding of stacks during the collection of profiling data.
The result of this is that all other profilers require either PMC access (which is not available in most virtualized environments) or debug symbols for all dependencies (which is time-consuming to obtain, disk-space-intensive, and generally deemed bad practice for production systems).
Prodfiler is different: Prodfiler can unwind stack traces through C/C++/Rust binaries even if the frame pointer has been omitted, without debug symbols present, and without PMC access.
We achieve this by doing some fairly heavy lifting from eBPF.
Broad language support
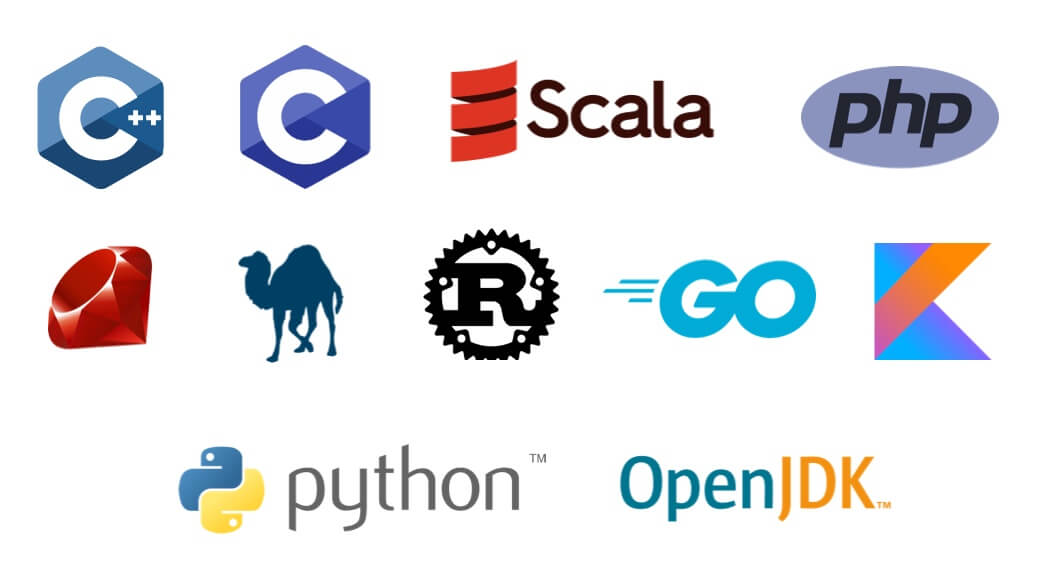
Modern organisations often run wildly heterogeneous stacks: Typically, a modern stack include some
Java, some Go, some Python, some C/C++ (often in dependencies), and often a mixture of multiple
languages in the same process or address space (think about Python code calling into C/C++ packages
such as xgboost or ormsgpack, or about the JVM calling into zlib).
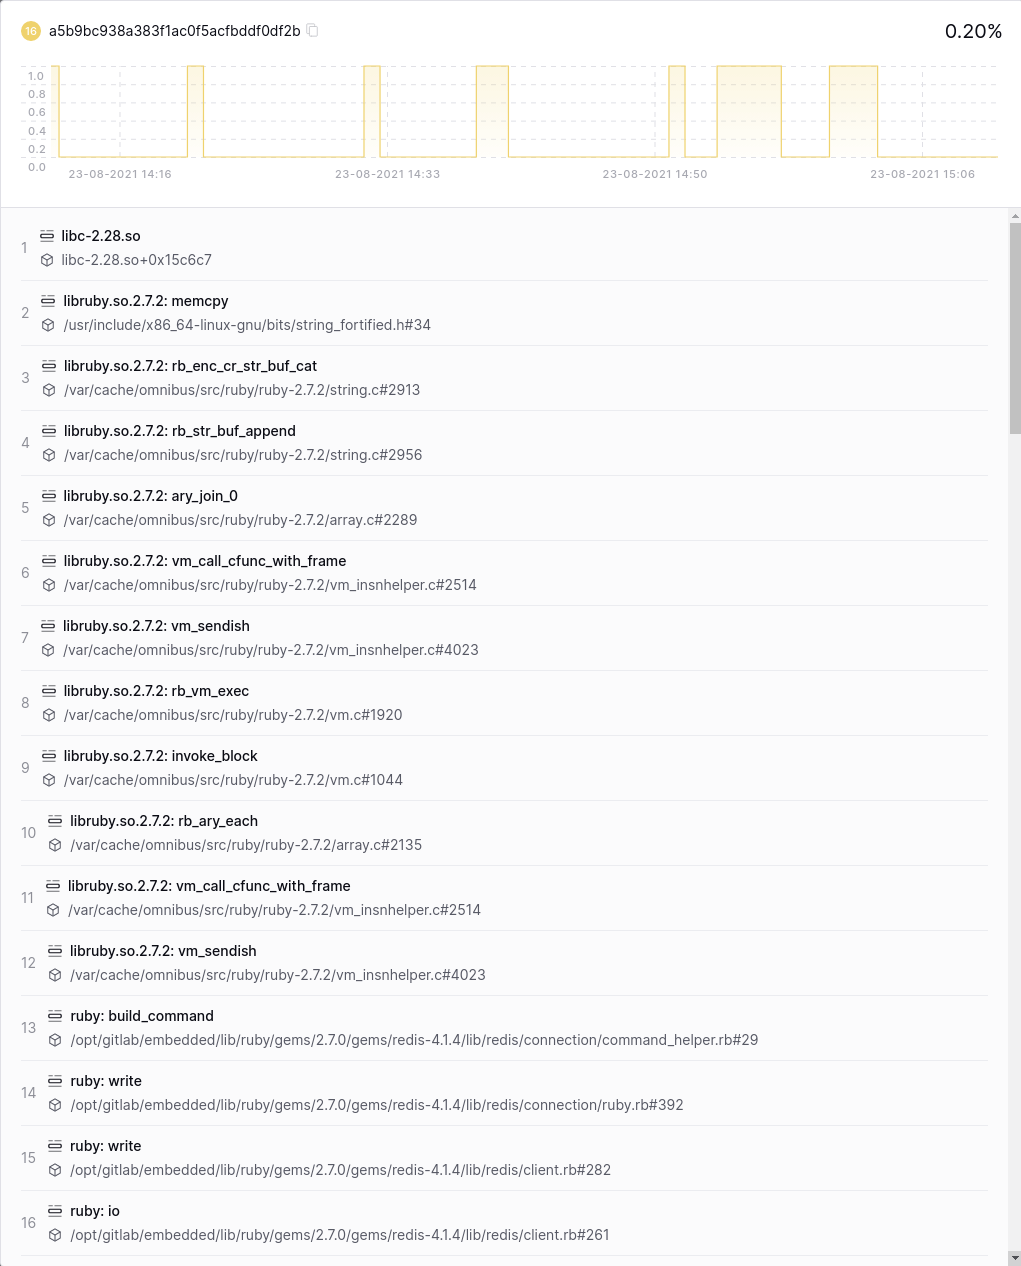
Automatic symbolization of upstream Debian/Ubuntu/Fedora packages
Hunting down debug information for all deployed executables is always a hassle, and often makes it difficult to draw optimal conclusions from the collected data.
In order to make this process less painful, Prodfiler does all symbolization for native code in the backend, and has pre-indexed all debug packages of all recent Debian, Ubuntu, and Fedora releases.
Furthermore, adding more debug symbols to the backend is easy, and allows ex-post symbolization even after the data has been collected.
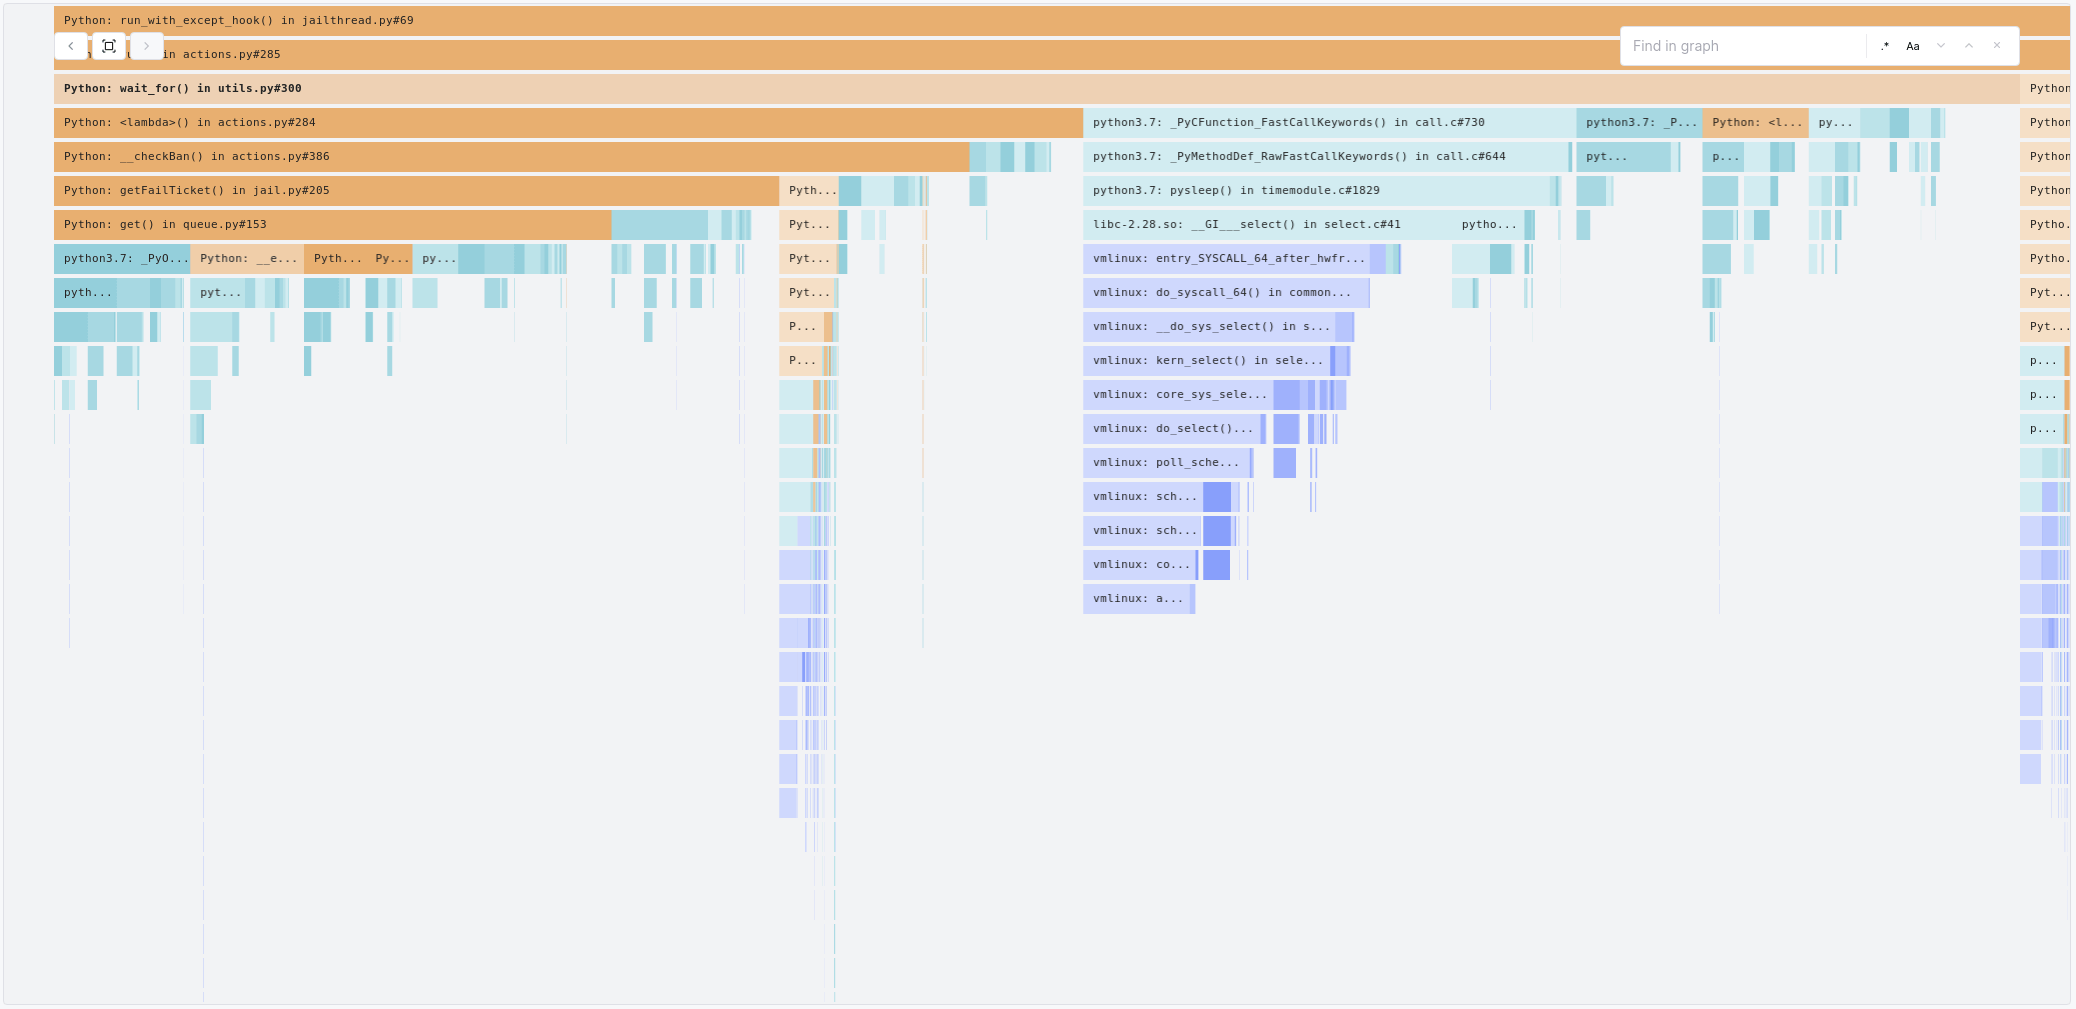
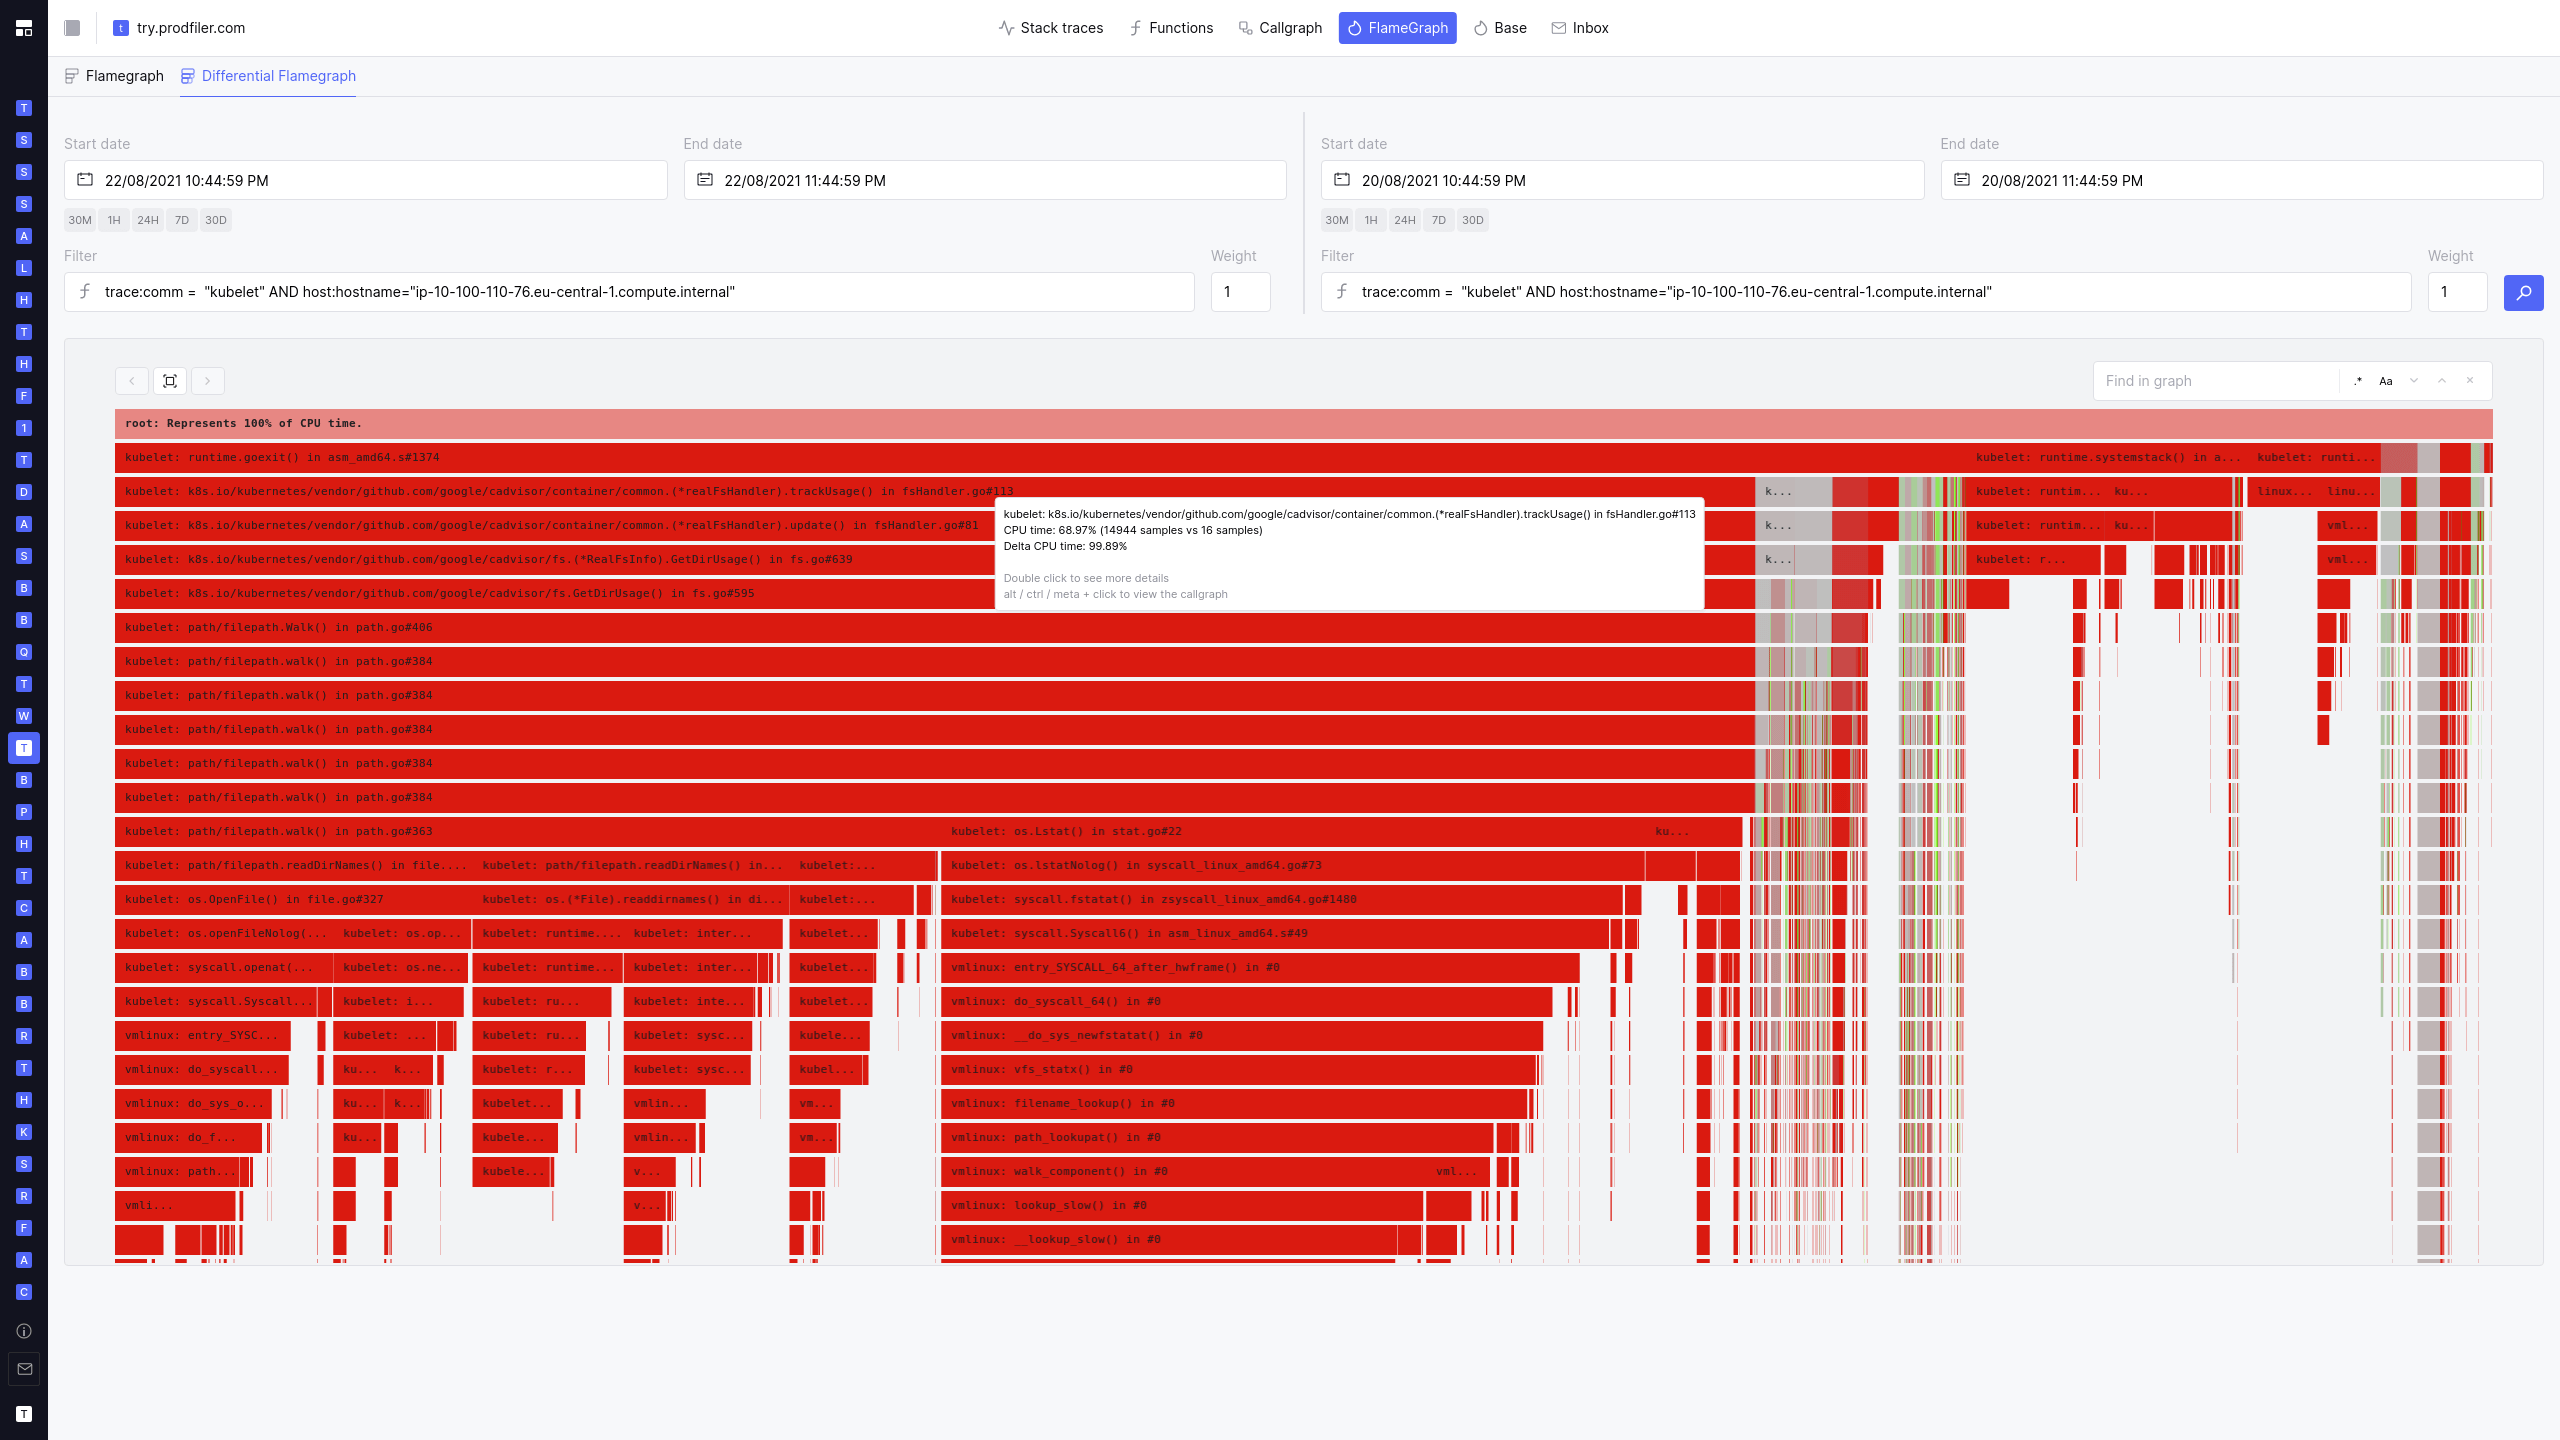
Flamegraphs and differential flamegraphs
Flamegraphs have emerged as the de-facto lingua franca of performance analysis. Unfortunately, SVG-based flamegraph visualisation often ends up having trouble with the sheer quantity of data to visualize. Prodfiler uses a custom-written WebGL-based Flamegraph implementation to allow filtering and navigating massive quantities of profiling data.
What’s more: Prodfiler features built-in differential flamegraphs to quickly identify which parts of a codebase deteriorated / improved.
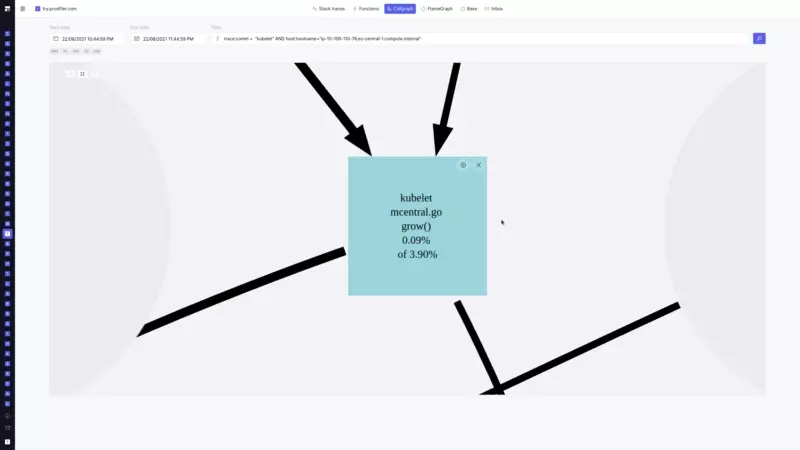
Interactive Callgraphs
Some people prefer callgraphs for their profiling needs, particularly in scenarios where library functions end up consuming significant amounts of CPU time. Prodfiler features interactive callgraphs to drill down into the details.
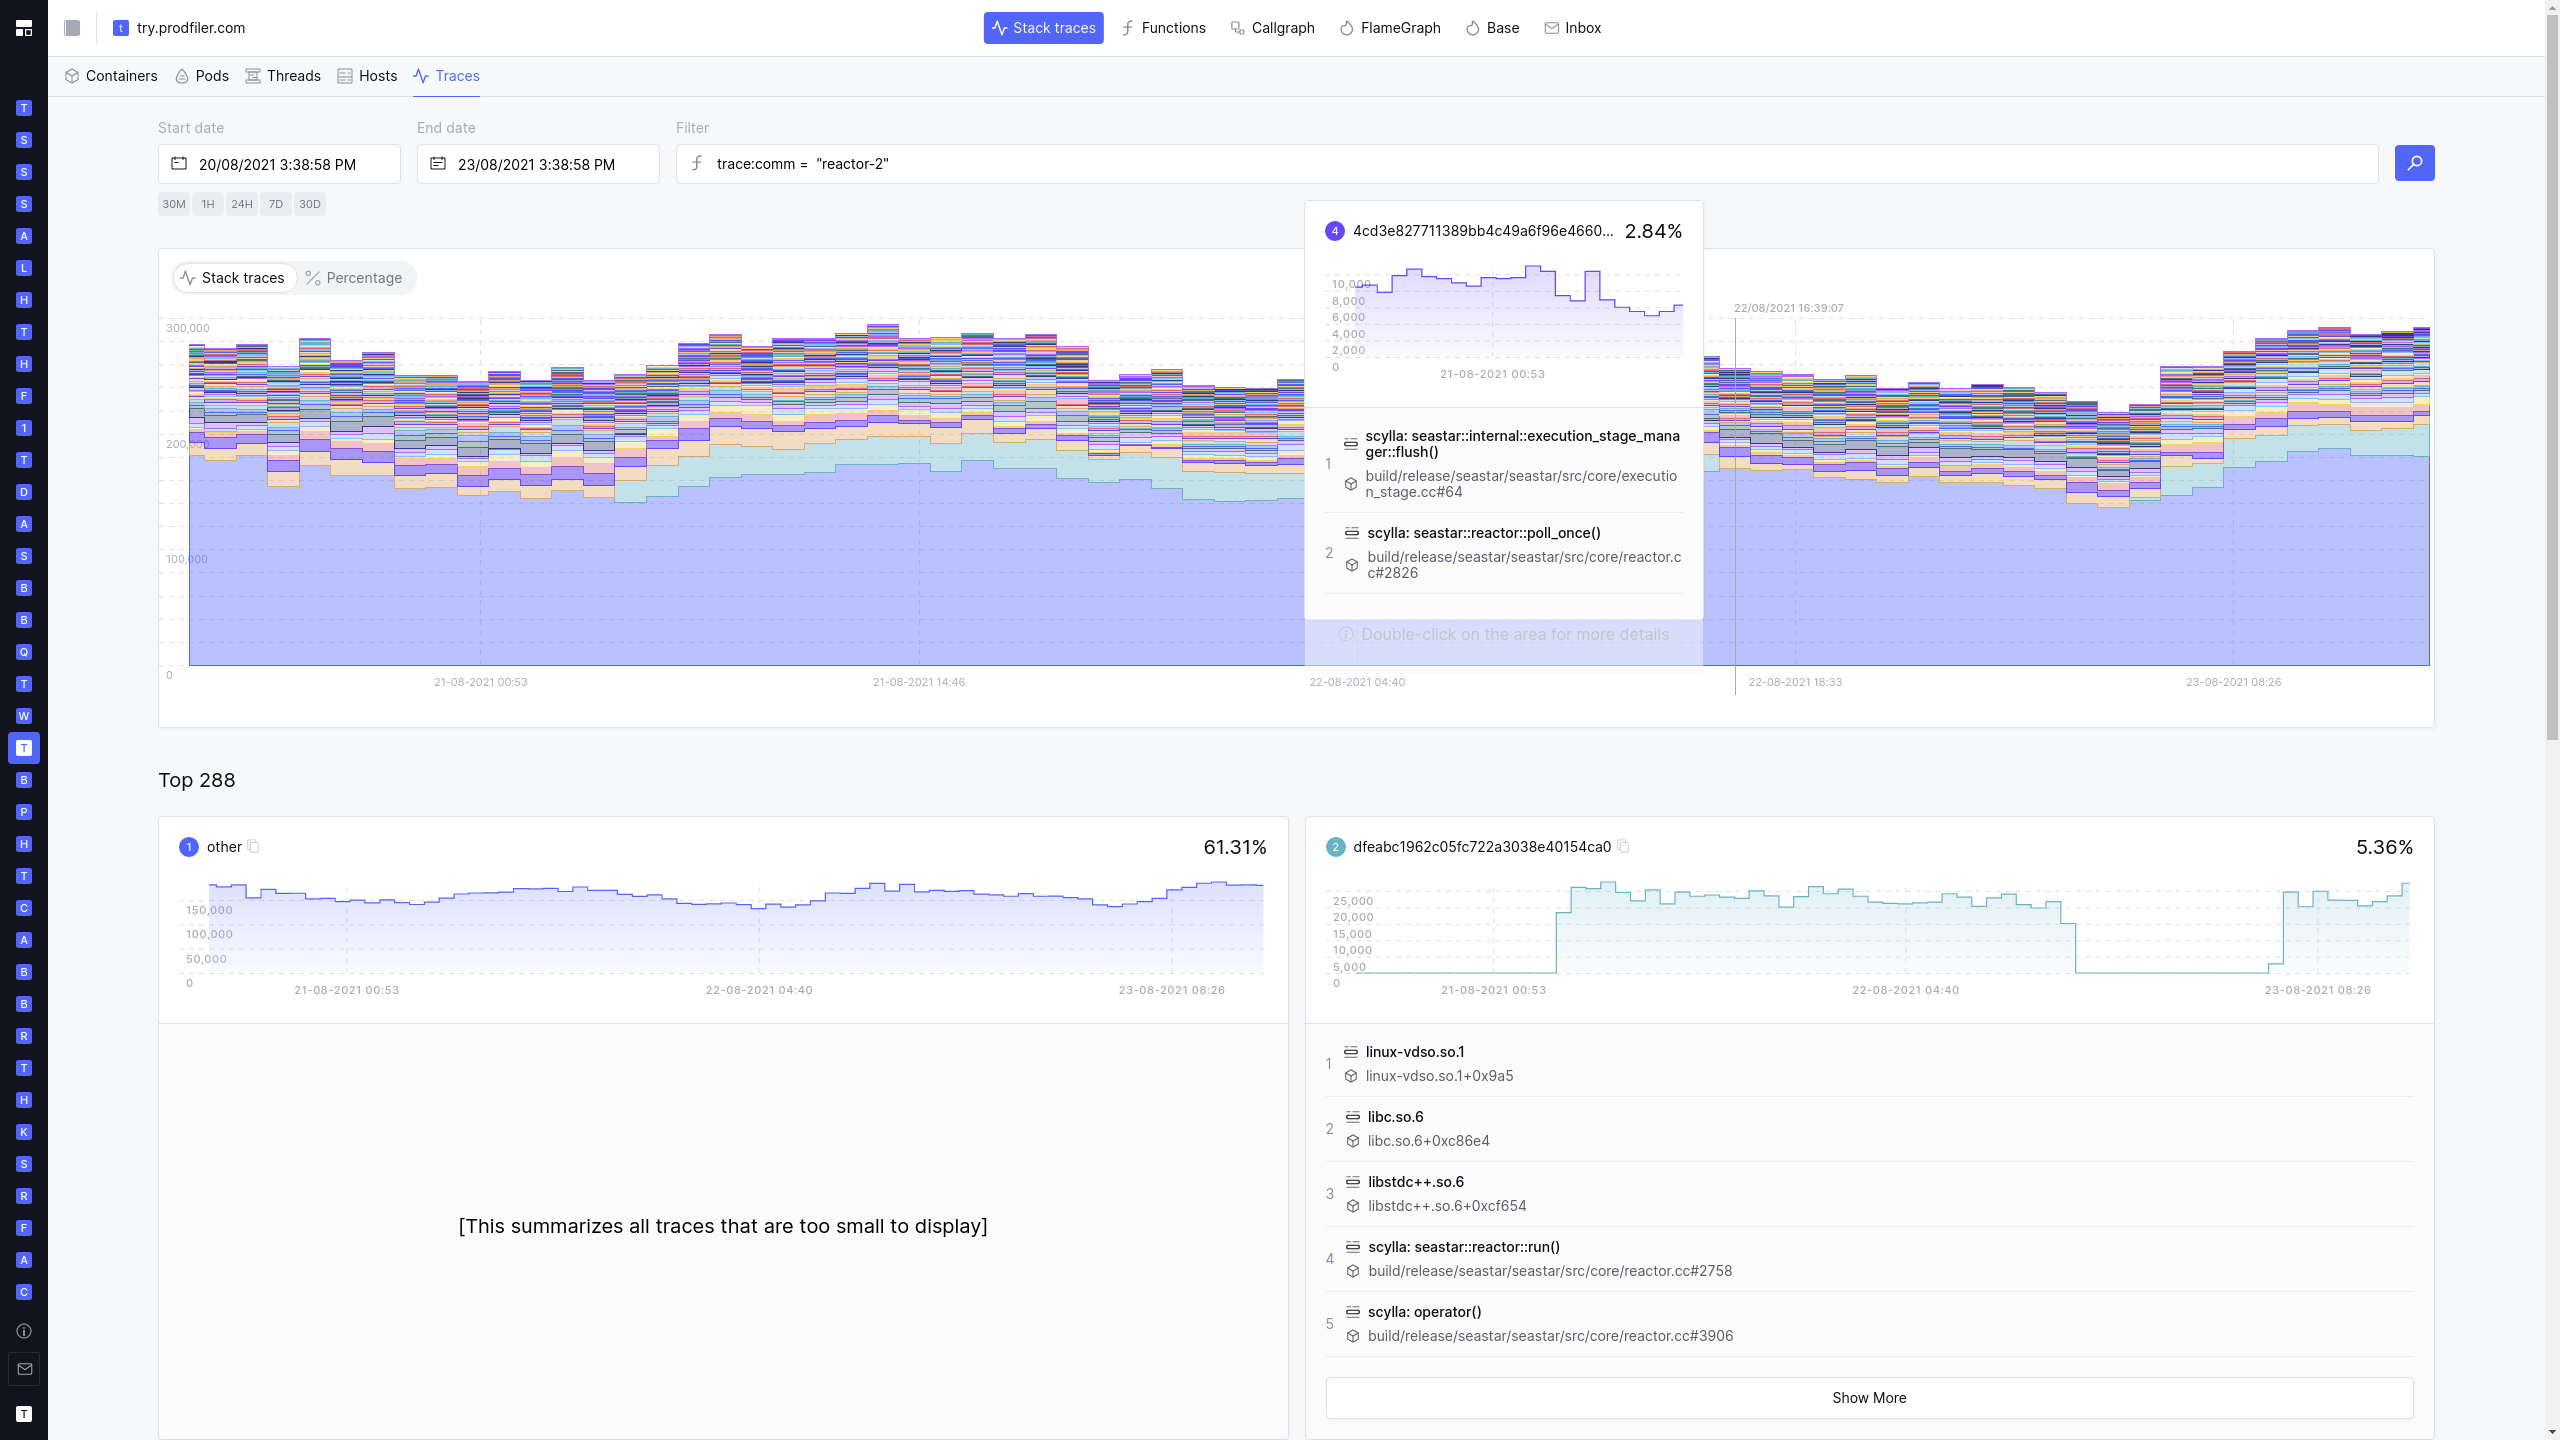
Powerful filtering
Do you want a flamegraph over your entire fleet of 1000 machines for the last month? Or do you prefer a flamegraph for a particular service on a particular node yesterday night from 1am to 1:15am?
Prodfiler has you covered: Our powerful filtering language allows drill-down on individual hosts, pods, containers, and even thread names.
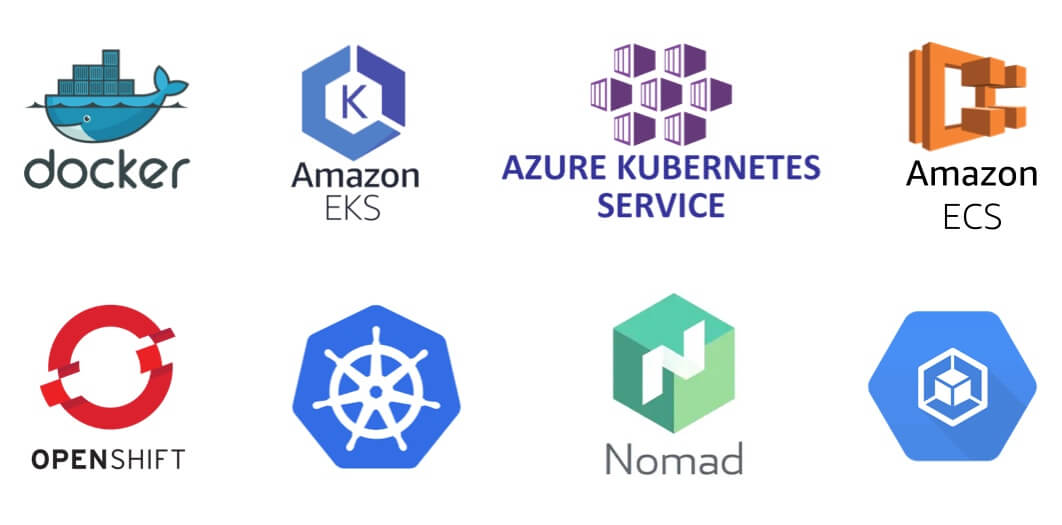
Support for all platforms that support eBPF
Prodfiler uses eBPF to do all of it’s magic; this means that the only system requirements are a relatively recent Linux Kernel (4.15 or newer will do), and the ability to run the relevant eBPF code in a privileged context.
This means that Prodfiler supports ECS, GKE, and many other managed container environments out of the box – and once Fargate adds eBPF support we will support Fargate, too.
Try it for free
Prodfiler is currently free-of-charge; simply click here to sign up and get started!